We've gathered data and other essential information about the program, such as the average salary of graduates, ethnicity of students, how many students graduated in recent times, and more. We've also included details on how BYU ranks compared to other colleges offering a major in compsci.
Jump to any of the following sections:
BYU was ranked #55 on College Factual's most recent list of the best schools for compsci majors. This puts the bachelor's program at the school solidly in the top 15% of all colleges and universities in the country. It is also ranked #1 in Utah.
| Ranking Type | Rank |
|---|---|
| Best Computer Science Master’s Degree Schools | 51 |
| Best Computer Science Graduate Degree Schools | 52 |
| Best Computer Science Schools | 55 |
| Best Computer Science Bachelor’s Degree Schools | 59 |
During the 2021-2022 academic year, Brigham Young University - Provo handed out 135 bachelor's degrees in computer science. This is a decrease of 6% over the previous year when 143 degrees were handed out.
In 2022, 28 students received their master’s degree in compsci from BYU. This makes it the #106 most popular school for compsci master’s degree candidates in the country.
In addition, 3 students received their doctoral degrees in compsci in 2022, making the school the #80 most popular school in the United States for this category of students.
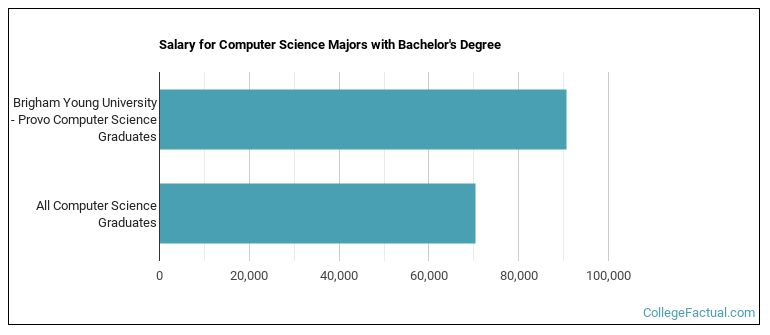
CompSci majors who earn their bachelor's degree from BYU go on to jobs where they make a median salary of $90,625 a year. This is higher than $70,400, which is the national median for all compsci bachelor's degree recipients.
Part-time undergraduates at BYU paid an average of $342 per credit hour in 2022-2023. This tuition was the same for both in-state and out-of-state students. The following table shows the average full-time tuition and fees for undergraduates.
| In State | Out of State | |
|---|---|---|
| Tuition | $6,496 | $6,496 |
| Books and Supplies | $1,040 | $1,040 |
| On Campus Room and Board | $9,720 | $9,720 |
| On Campus Other Expenses | $5,736 | $5,736 |
Learn more about BYU tuition and fees.
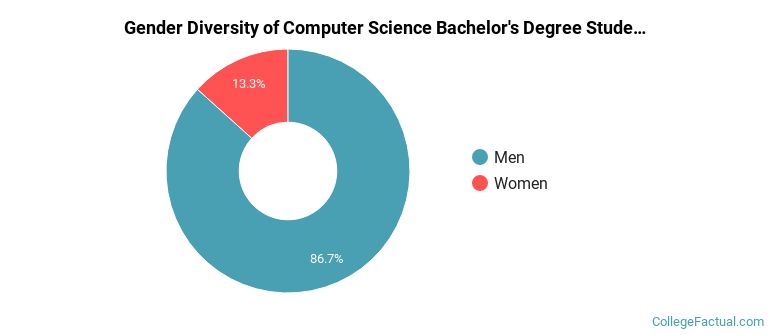
Of the 135 students who graduated with a Bachelor’s in compsci from BYU in 2022, 87% were men and 13% were women.
The majority of bachelor's degree recipients in this major at BYU are white. In the most recent graduating class for which data is available, 87% of students fell into this category.
The following table and chart show the ethnic background for students who recently graduated from Brigham Young University - Provo with a bachelor's in compsci.
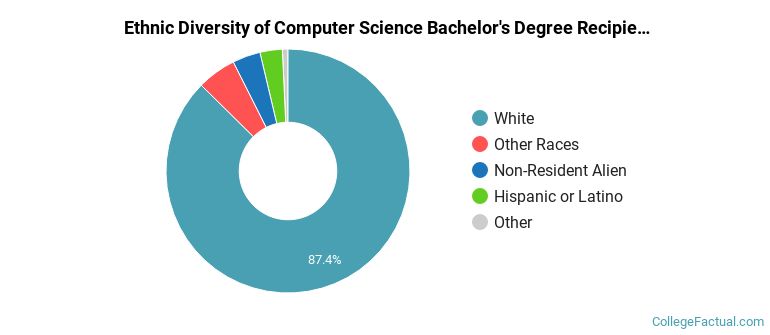
| Ethnic Background | Number of Students |
|---|---|
| Asian | 1 |
| Black or African American | 0 |
| Hispanic or Latino | 4 |
| White | 118 |
| Non-Resident Aliens | 5 |
| Other Races | 7 |
Online degrees for the BYU compsci bachelor’s degree program are not available at this time. To see if the school offers distance learning options in other areas, visit the BYU Online Learning page.
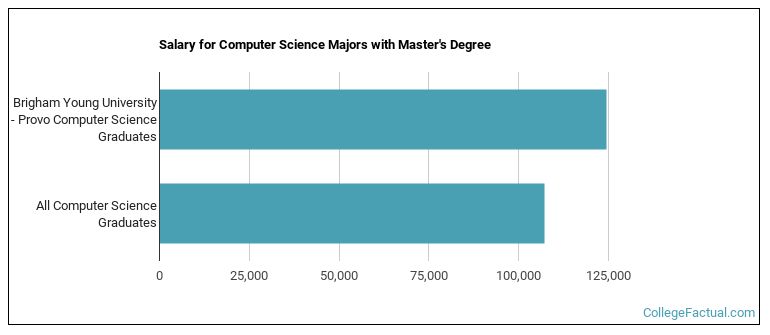
Graduates of the master's compsci program at BYU make a median salary of $124,425. This is a better than average outcome since the median salary for all compsci graduates with a master's is $107,251.
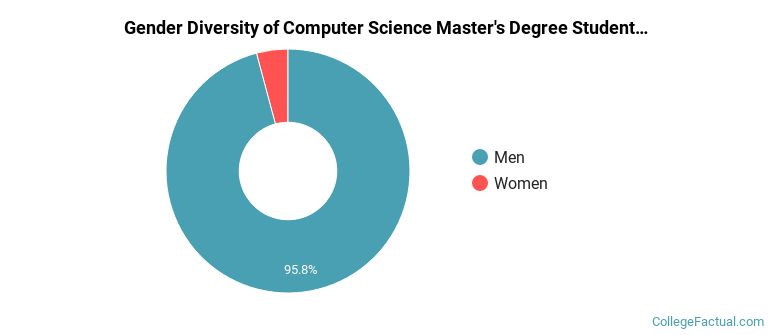
Of the 24 compsci students who graduated with a master's degree in 2021-2022 from BYU, about 96% were men and 4% were women.
The majority of master's degree recipients in this major at BYU are white. In the most recent graduating class for which data is available, 96% of students fell into this category.
The following table and chart show the ethnic background for students who recently graduated from Brigham Young University - Provo with a master's in compsci.
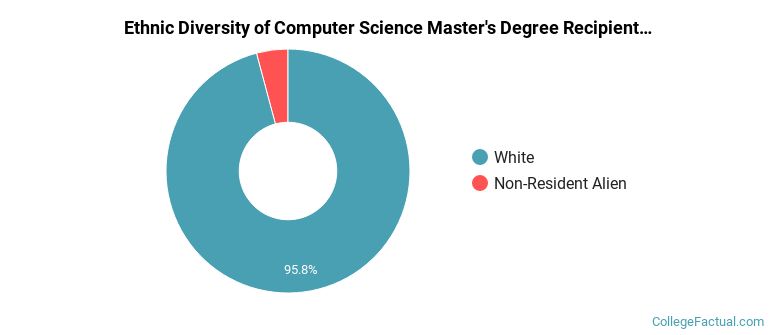
| Ethnic Background | Number of Students |
|---|---|
| Asian | 0 |
| Black or African American | 0 |
| Hispanic or Latino | 0 |
| White | 23 |
| Non-Resident Aliens | 1 |
| Other Races | 0 |
Take a look at the following statistics related to the make-up of the compsci majors at Brigham Young University - Provo.
| Related Major | Annual Graduates |
|---|---|
| Information Technology | 301 |
| Computer Information Systems | 48 |
| Computer Software & Applications | 9 |
More about our data sources and methodologies.