BYU total enrollment is approximately 36,461 students. 30,039 are undergraduates and 1,887 are graduate students.
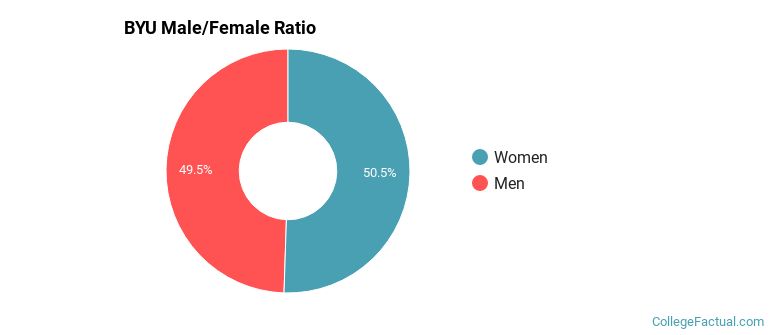
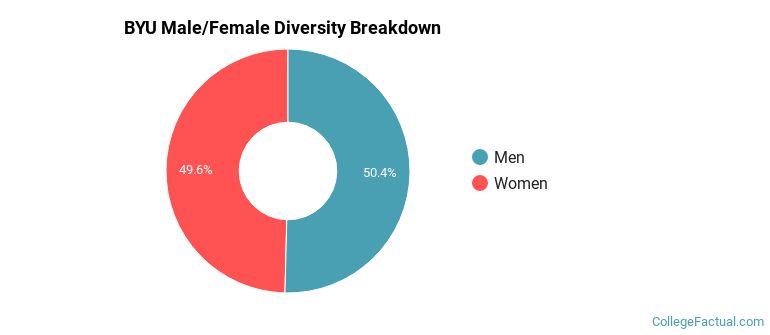
Male/Female Breakdown of Undergraduates
The full-time BYU undergraduate population is made up of 51% women, and 49% men.
For the gender breakdown for all students, go here.
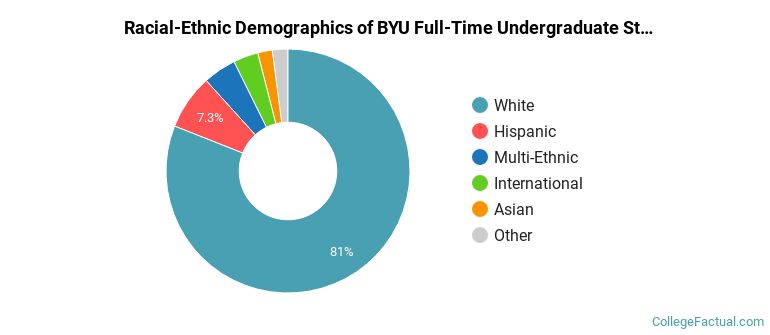
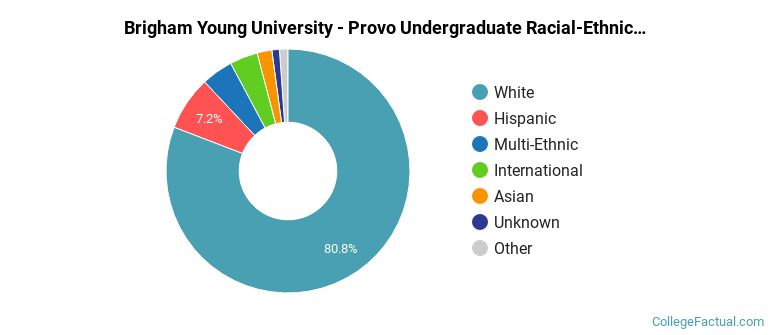
BYU Racial/Ethnic Breakdown of Undergraduates
| Race/Ethnicity | Number |
|---|---|
| White | 24,347 |
| Hispanic | 2,144 |
| Multi-Ethnic | 1,361 |
| International | 914 |
| Asian | 541 |
| Unknown | 338 |
| Native Hawaiian or Pacific Islander | 206 |
| Black or African American | 117 |
See racial/ethnic breakdown for all students.
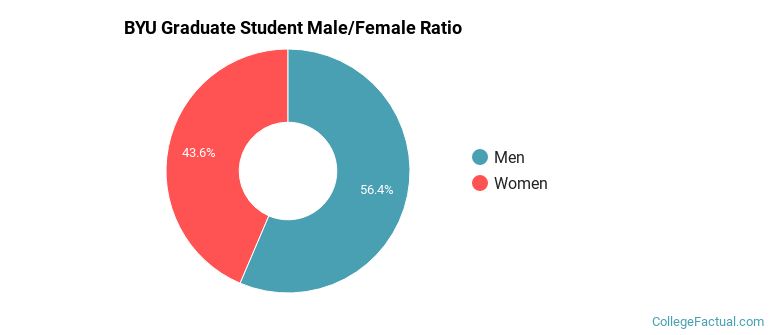
Male/Female Breakdown of Graduate Students
About 46% of full-time grad students are women, and 54% men.
For the gender breakdown for all students, go here.
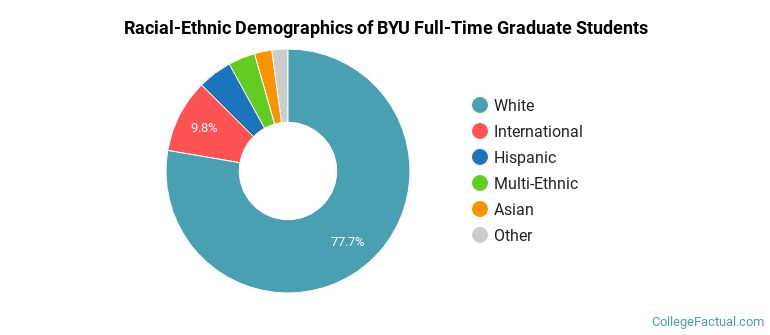
BYU Racial-Ethnic Breakdown of Graduate Students
| Race/Ethnicity | Number |
|---|---|
| White | 1,448 |
| International | 176 |
| Hispanic | 121 |
| Multi-Ethnic | 60 |
| Asian | 40 |
| Unknown | 14 |
| Black or African American | 12 |
| Native Hawaiian or Pacific Islander | 8 |
See racial/ethnic breakdown for all students.
| Race/Ethnicity | Number |
|---|---|
| White | 29,423 |
| Hispanic | 2,619 |
| Multi-Ethnic | 1,589 |
| International | 1,275 |
| Asian | 674 |
| Unknown | 408 |
| Native Hawaiian or Pacific Islander | 247 |
| Black or African American | 143 |
There are approximately 18,293 female students and 18,168 male students at BYU.
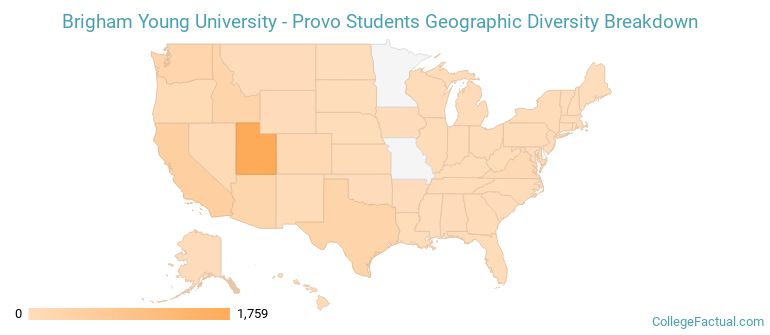
BYU ranks 114 out of 2,183 when it comes to geographic diversity.
62.83% of BYU students come from out of state, and 2.27% come from out of the country.
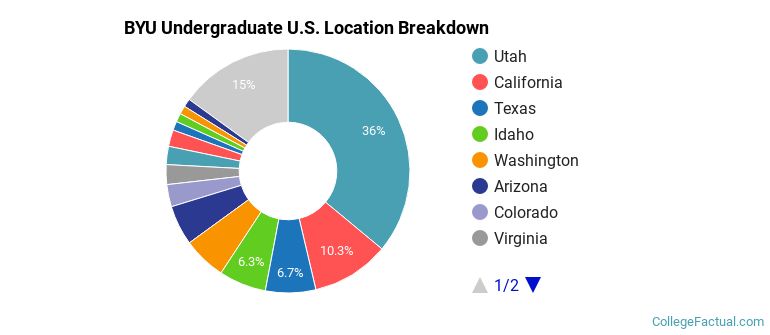
The undergraduate student body is split among 48 states (may include Washington D.C.). Click on the map for more detail.
| State | Amount |
|---|---|
| Utah | 1,759 |
| California | 503 |
| Texas | 325 |
| Idaho | 306 |
| Washington | 280 |
Students from 100 countries are represented at this school, with the majority of the international students coming from Canada, South Korea, and China.
Learn more about international students at BYU.
A traditional college student is defined as being between the ages of 18-21. At BYU, 38.45% of students fall into that category, compared to the national average of 60%.
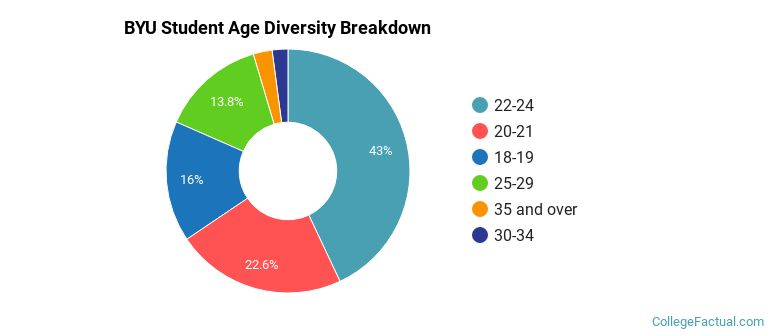
| Student Age Group | Amount |
|---|---|
| 22-24 | 14,706 |
| 20-21 | 7,720 |
| 18-19 | 5,482 |
| 25-29 | 4,730 |
| 35 and over | 858 |
| 30-34 | 715 |
| Under 18 | 0 |
Footnotes
*The racial-ethnic minorities count is calculated by taking the total number of students and subtracting white students, international students, and students whose race/ethnicity was unknown. This number is then divided by the total number of students at the school to obtain the racial-ethnic minorities percentage.
References
Department of Homeland Security Citizenship and Immigration Services
Learn more about how College Factual creates their Diversity Rankings.