BC total enrollment is approximately 33,243 students.
Male/Female Breakdown of Undergraduates
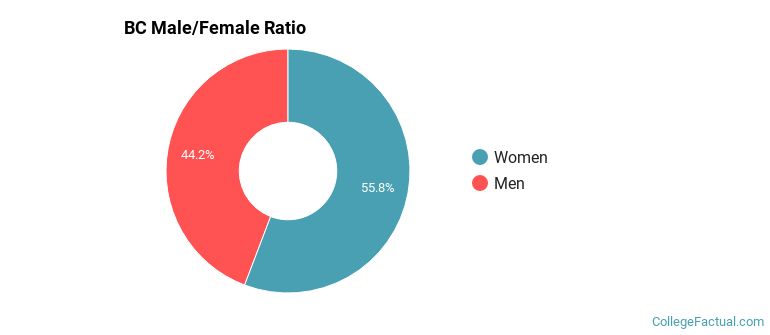
The full-time BC undergraduate population is made up of 59% women, and 41% men.
For the gender breakdown for all students, go here.
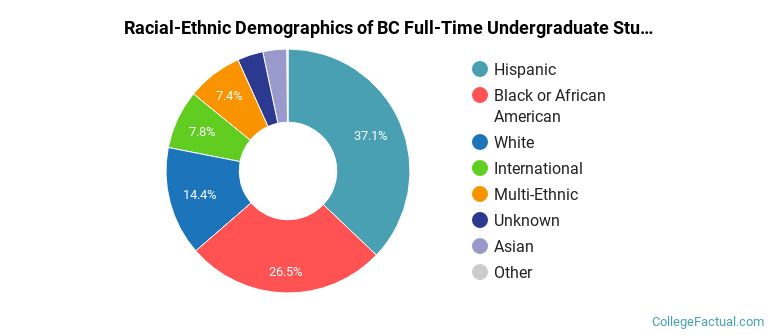
BC Racial/Ethnic Breakdown of Undergraduates
| Race/Ethnicity | Number |
|---|---|
| Hispanic | 4,055 |
| Black or African American | 2,651 |
| White | 1,508 |
| Multi-Ethnic | 985 |
| International | 764 |
| Unknown | 370 |
| Asian | 347 |
| Native Hawaiian or Pacific Islander | 25 |
See racial/ethnic breakdown for all students.
| Race/Ethnicity | Number |
|---|---|
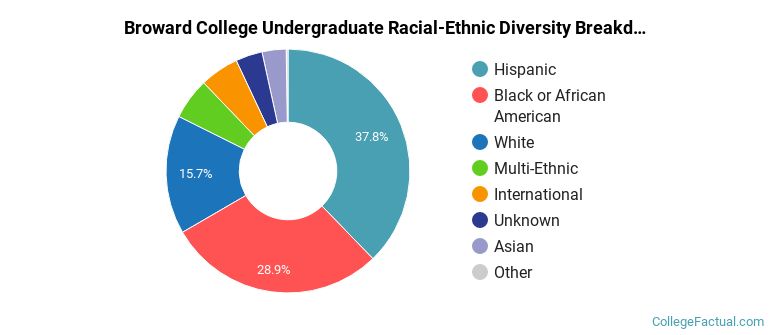
| Hispanic | 12,501 |
| Black or African American | 9,062 |
| White | 5,331 |
| Multi-Ethnic | 2,253 |
| International | 1,645 |
| Unknown | 1,214 |
| Asian | 1,110 |
| Native Hawaiian or Pacific Islander | 79 |
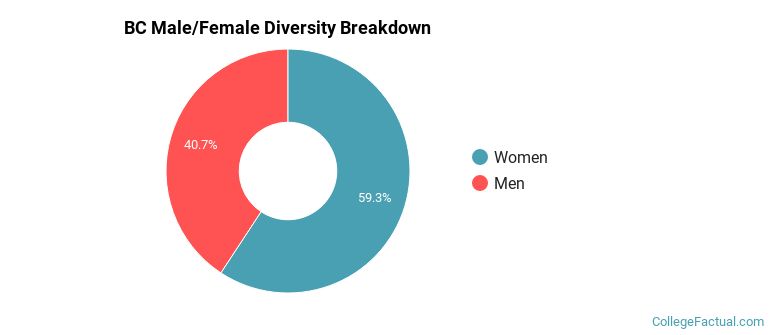
There are approximately 20,470 female students and 12,773 male students at BC.
BC ranks 1,867 out of 2,183 when it comes to geographic diversity.
0.38% of BC students come from out of state, and 0.01% come from out of the country.
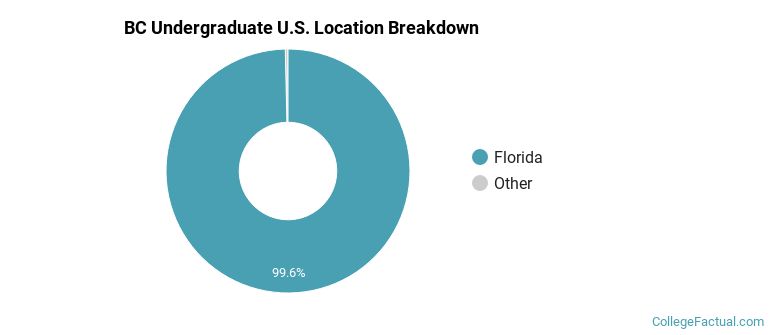
The undergraduate student body is split among 13 states (may include Washington D.C.). Click on the map for more detail.
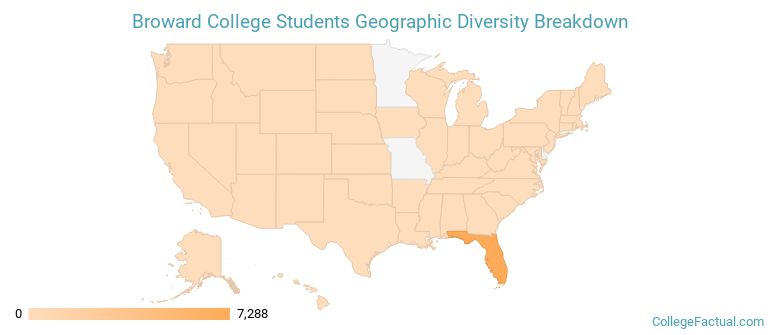
| State | Amount |
|---|---|
| Florida | 7,288 |
| New Jersey | 5 |
| New York | 5 |
| Massachusetts | 3 |
| North Carolina | 3 |
Students from 94 countries are represented at this school, with the majority of the international students coming from Venezuela, Brazil, and Jamaica.
Learn more about international students at BC.
A traditional college student is defined as being between the ages of 18-21. At BC, 41.36% of students fall into that category, compared to the national average of 60%.
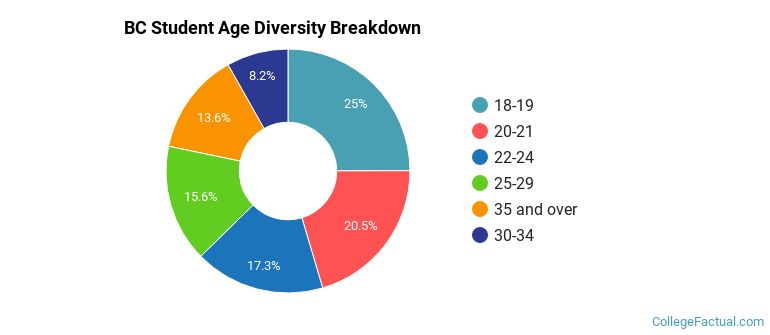
| Student Age Group | Amount |
|---|---|
| 18-19 | 9,265 |
| 20-21 | 7,592 |
| 22-24 | 6,408 |
| 25-29 | 5,783 |
| 35 and over | 5,039 |
| 30-34 | 3,036 |
| Under 18 | 0 |
Footnotes
*The racial-ethnic minorities count is calculated by taking the total number of students and subtracting white students, international students, and students whose race/ethnicity was unknown. This number is then divided by the total number of students at the school to obtain the racial-ethnic minorities percentage.
References
Department of Homeland Security Citizenship and Immigration Services
Read College Factual's Diversity Ranking Methodology.