Here, you'll find out more about the major, including such details as the number of graduates, what degree levels are offered, ethnicity of students, average salaries, and more. Also, learn how Brown ranks among other schools offering degrees in applied math.
Go directly to any of the following sections:
Learn about start dates, transferring credits, availability of financial aid, and more by contacting the universities below.
If you have a knack for mathematics and an interest in learning more, study online to achieve your career goals at Southern New Hampshire University. Our mathematics degree can help you enhance your mathematical abilities, including reasoning and problem-solving in three areas: analysis, algebra and statistics.
BA in Mathematics - Applied Mathematics
Put mathematical concepts to work to solve today's most complex real-world problems by studying applied mathematics with this specialized online bachelor's from Southern New Hampshire University.
The bachelor's program at Brown was ranked #1 on College Factual's Best Schools for applied math list. It is also ranked #1 in Rhode Island.
During the 2021-2022 academic year, Brown University handed out 178 bachelor's degrees in applied mathematics. This is an increase of 36% over the previous year when 131 degrees were handed out.
In 2022, 12 students received their master’s degree in applied math from Brown. This makes it the #85 most popular school for applied math master’s degree candidates in the country.
In addition, 3 students received their doctoral degrees in applied math in 2022, making the school the #36 most popular school in the United States for this category of students.
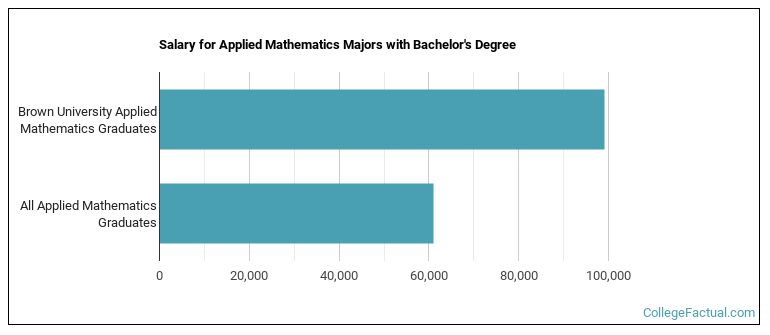
The median salary of applied math students who receive their bachelor's degree at Brown is $99,193. This is great news for graduates of the program, since this figure is higher than the national average of $60,930 for all applied math bachelor's degree recipients.
In 2022-2023, the average part-time undergraduate tuition at Brown was $2,051 per credit hour for both in-state and out-of-state students. The average full-time tuition and fees for undergraduates are shown in the table below.
| In State | Out of State | |
|---|---|---|
| Tuition | $65,656 | $65,656 |
| Fees | $2,574 | $2,574 |
| On Campus Room and Board | $16,598 | $16,598 |
| On Campus Other Expenses | $2,820 | $2,820 |
Learn more about Brown tuition and fees.
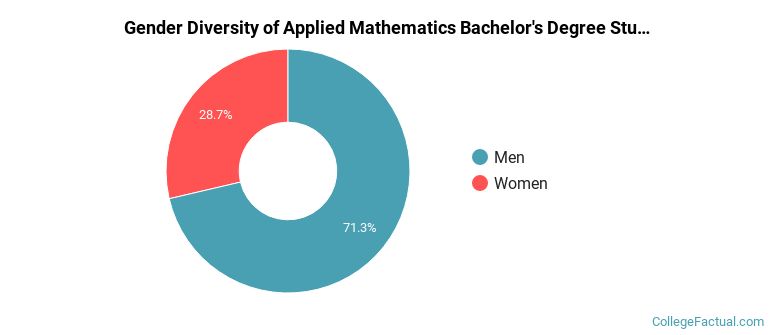
Of the 178 applied math students who graduated with a bachelor's degree in 2021-2022 from Brown, about 71% were men and 29% were women.
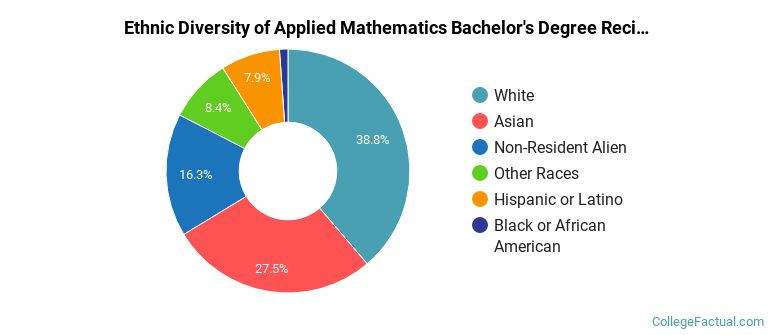
The following table and chart show the ethnic background for students who recently graduated from Brown University with a bachelor's in applied math.
| Ethnic Background | Number of Students |
|---|---|
| Asian | 49 |
| Black or African American | 2 |
| Hispanic or Latino | 14 |
| White | 69 |
| Non-Resident Aliens | 29 |
| Other Races | 15 |
Brown does not offer an online option for its applied math bachelor’s degree program at this time. To see if the school offers distance learning options in other areas, visit the Brown Online Learning page.
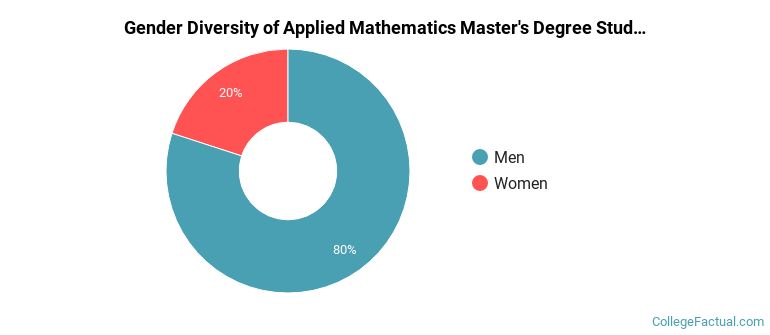
During the 2021-2022 academic year, 5 students graduated with a master's degree in applied math from Brown. About 80% were men and 20% were women.
The following table and chart show the ethnic background for students who recently graduated from Brown University with a master's in applied math.
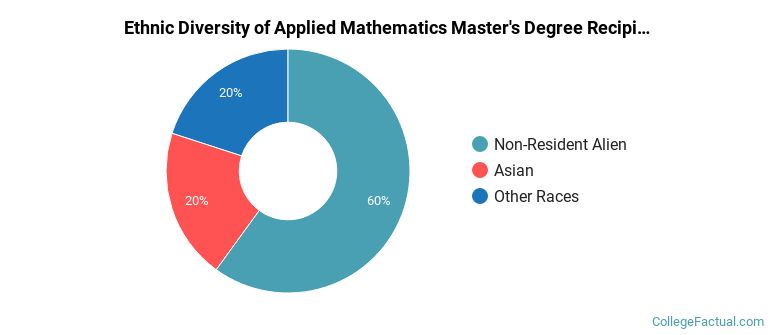
| Ethnic Background | Number of Students |
|---|---|
| Asian | 1 |
| Black or African American | 0 |
| Hispanic or Latino | 0 |
| White | 0 |
| Non-Resident Aliens | 3 |
| Other Races | 1 |
Take a look at the following statistics related to the make-up of the applied math majors at Brown University.
| Related Major | Annual Graduates |
|---|---|
| Mathematics | 33 |
| Statistics | 4 |
More about our data sources and methodologies.
