Brown total enrollment is approximately 9,948 students. 6,605 are undergraduates and 3,008 are graduate students.
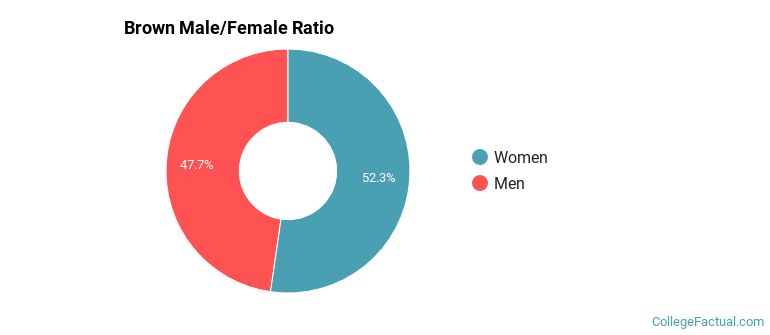
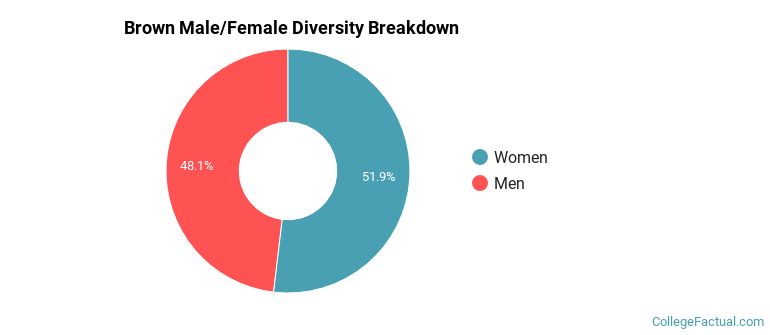
Male/Female Breakdown of Undergraduates
The full-time Brown undergraduate population is made up of 53% women, and 47% men.
For the gender breakdown for all students, go here.
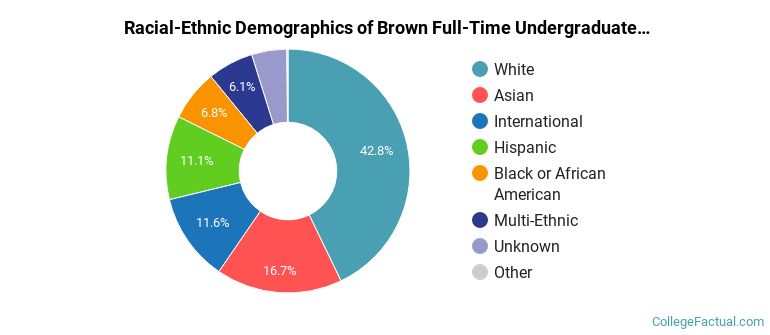
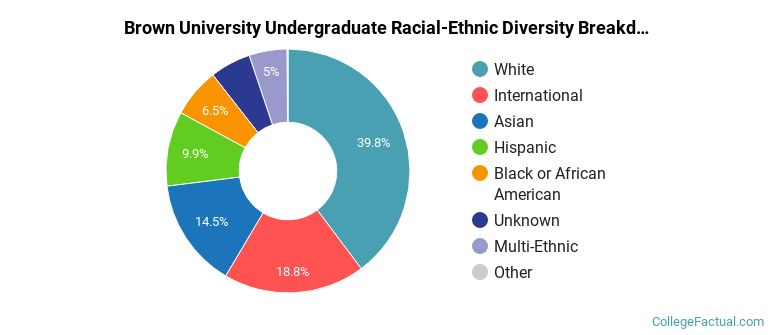
Brown Racial/Ethnic Breakdown of Undergraduates
| Race/Ethnicity | Number |
|---|---|
| White | 2,744 |
| Asian | 1,224 |
| Hispanic | 734 |
| International | 733 |
| Black or African American | 478 |
| Multi-Ethnic | 417 |
| Unknown | 242 |
| Native Hawaiian or Pacific Islander | 10 |
See racial/ethnic breakdown for all students.
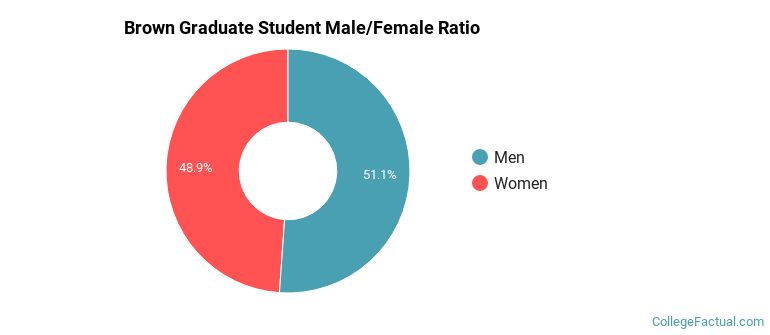
Male/Female Breakdown of Graduate Students
About 50% of full-time grad students are women, and 50% men.
For the gender breakdown for all students, go here.
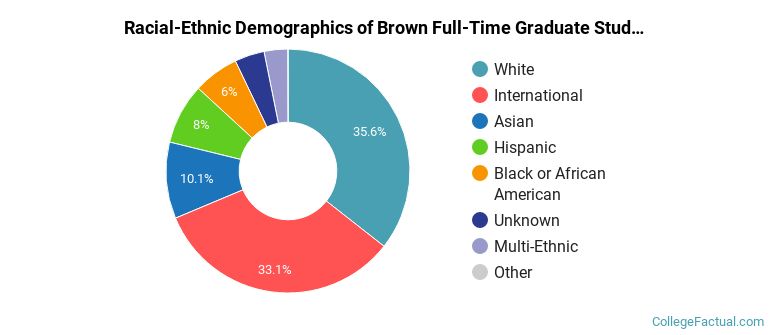
Brown Racial-Ethnic Breakdown of Graduate Students
| Race/Ethnicity | Number |
|---|---|
| White | 1,071 |
| International | 902 |
| Asian | 325 |
| Hispanic | 261 |
| Black or African American | 214 |
| Multi-Ethnic | 116 |
| Unknown | 110 |
| Native Hawaiian or Pacific Islander | 2 |
See racial/ethnic breakdown for all students.
| Race/Ethnicity | Number |
|---|---|
| White | 3,880 |
| International | 1,762 |
| Asian | 1,569 |
| Hispanic | 1,019 |
| Black or African American | 700 |
| Multi-Ethnic | 536 |
| Unknown | 438 |
| Native Hawaiian or Pacific Islander | 13 |
There are approximately 5,208 female students and 4,740 male students at Brown.
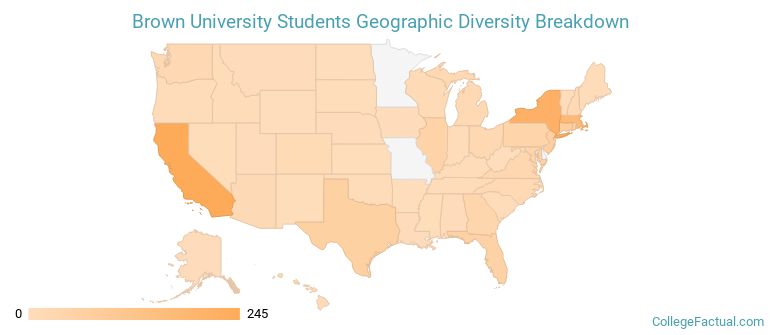
Brown ranks 3 out of 2,183 when it comes to geographic diversity.
95.54% of Brown students come from out of state, and 14.18% come from out of the country.
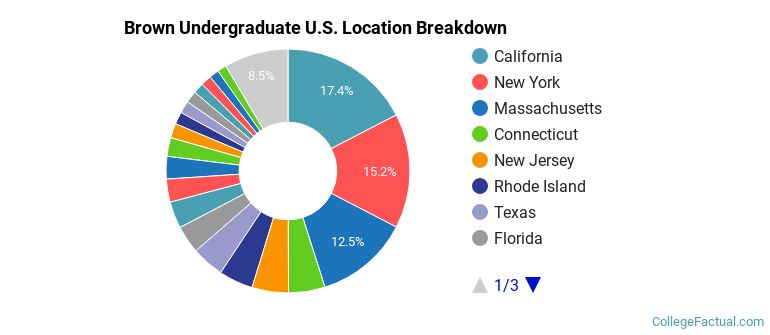
The undergraduate student body is split among 46 states (may include Washington D.C.). Click on the map for more detail.
| State | Amount |
|---|---|
| California | 245 |
| New York | 214 |
| Massachusetts | 176 |
| Connecticut | 68 |
| New Jersey | 68 |
Students from 117 countries are represented at this school, with the majority of the international students coming from China, India, and Canada.
Learn more about international students at Brown.
A traditional college student is defined as being between the ages of 18-21. At Brown, 61.62% of students fall into that category, compared to the national average of 60%.
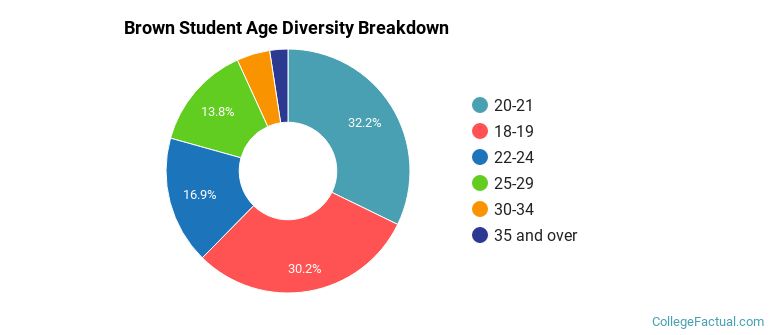
| Student Age Group | Amount |
|---|---|
| 20-21 | 3,212 |
| 18-19 | 3,009 |
| 22-24 | 1,690 |
| 25-29 | 1,380 |
| 30-34 | 439 |
| 35 and over | 241 |
| Under 18 | 0 |
Footnotes
*The racial-ethnic minorities count is calculated by taking the total number of students and subtracting white students, international students, and students whose race/ethnicity was unknown. This number is then divided by the total number of students at the school to obtain the racial-ethnic minorities percentage.
References
Department of Homeland Security Citizenship and Immigration Services
Image Credit: By Ad Meskens under License
Read College Factual's Diversity Ranking Methodology.