BVU total enrollment is approximately 1,863 students. 1,230 are undergraduates and 4 are graduate students.
Male/Female Breakdown of Undergraduates
The full-time BVU undergraduate population is made up of 62% women, and 38% men.
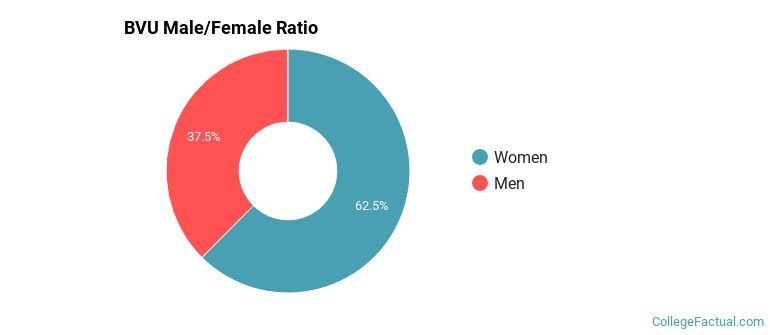
For the gender breakdown for all students, go here.
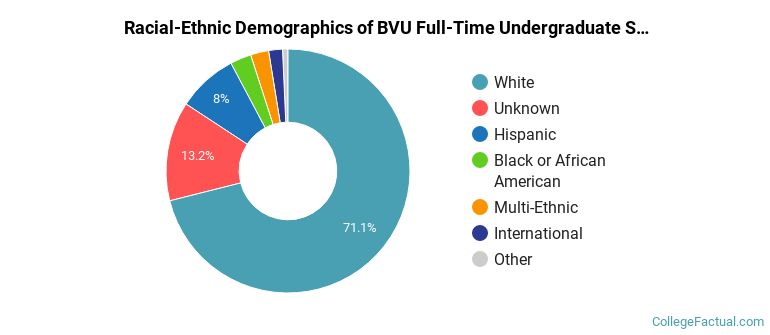
BVU Racial/Ethnic Breakdown of Undergraduates
| Race/Ethnicity | Number |
|---|---|
| White | 907 |
| Hispanic | 137 |
| Unknown | 78 |
| Multi-Ethnic | 47 |
| Black or African American | 37 |
| Asian | 10 |
| International | 4 |
| Native Hawaiian or Pacific Islander | 1 |
See racial/ethnic breakdown for all students.
Male/Female Breakdown of Graduate Students
About 75% of full-time grad students are women, and 25% men.

For the gender breakdown for all students, go here.
BVU Racial-Ethnic Breakdown of Graduate Students

| Race/Ethnicity | Number |
|---|---|
| White | 4 |
| Asian | 0 |
| Black or African American | 0 |
| Hispanic | 0 |
| Native Hawaiian or Pacific Islander | 0 |
| International | 0 |
| Multi-Ethnic | 0 |
| Unknown | 0 |
See racial/ethnic breakdown for all students.
| Race/Ethnicity | Number |
|---|---|
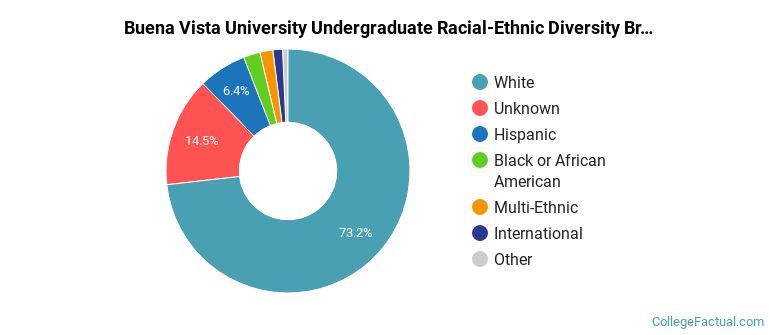
| White | 1,418 |
| Hispanic | 151 |
| Unknown | 129 |
| Multi-Ethnic | 87 |
| Black or African American | 47 |
| Asian | 16 |
| International | 4 |
| Native Hawaiian or Pacific Islander | 1 |
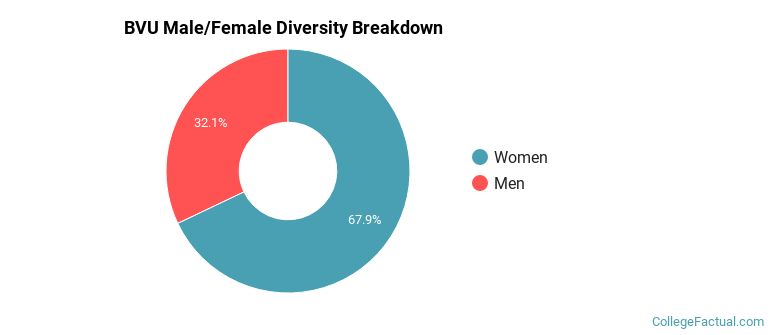
There are approximately 1,267 female students and 596 male students at BVU.
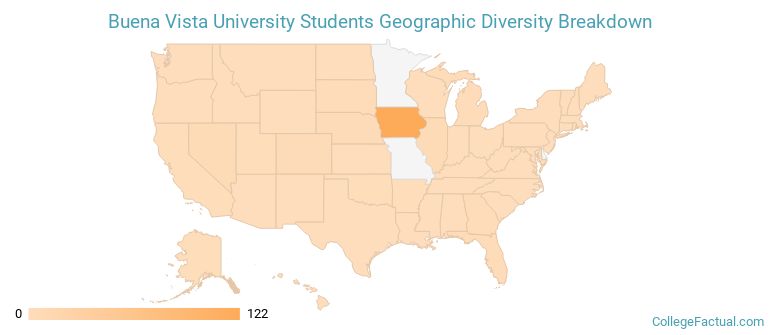
BVU ranks 880 out of 2,183 when it comes to geographic diversity.
30.68% of BVU students come from out of state, and 2.73% come from out of the country.
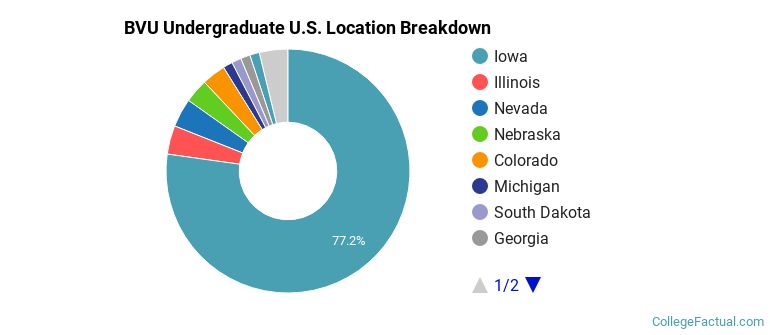
The undergraduate student body is split among 15 states (may include Washington D.C.). Click on the map for more detail.
| State | Amount |
|---|---|
| Iowa | 122 |
| Illinois | 6 |
| Nevada | 6 |
| Colorado | 5 |
| Nebraska | 5 |
Students from 18 countries are represented at this school, with the majority of the international students coming from Rwanda, South Korea, and Burundi.
Learn more about international students at BVU.
A traditional college student is defined as being between the ages of 18-21. At BVU, 40.77% of students fall into that category, compared to the national average of 60%.
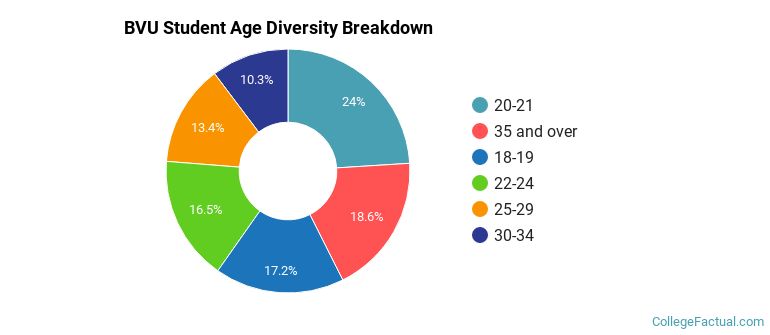
| Student Age Group | Amount |
|---|---|
| 20-21 | 471 |
| 35 and over | 365 |
| 18-19 | 337 |
| 22-24 | 324 |
| 25-29 | 264 |
| 30-34 | 202 |
| Under 18 | 0 |
Footnotes
*The racial-ethnic minorities count is calculated by taking the total number of students and subtracting white students, international students, and students whose race/ethnicity was unknown. This number is then divided by the total number of students at the school to obtain the racial-ethnic minorities percentage.
References
Department of Homeland Security Citizenship and Immigration Services
Image Credit: By Ryan Harder under License