Here is an overview of this program at Butler University. Degrees are awarded at the Bachelor’s level, with graduate study also available. Its best result is a rank of #1 out of 6 schools (Bachelor’s level) by College Factual. Jump to any of the following sections:
College Factual rates Butler University as a strong choice for music, ranked #40 out of 416 schools nationally.
| Ranking | Rank |
|---|---|
| Best Music Schools | 40 of 416 |
| Best Music Schools in Indiana | 1 of 6 |
| Best Music Schools in the Great Lakes Region | 4 of 51 |
Here is each degree level offered in music at Butler University, along with how many graduates complete each level annually.
| Degree Level | Annual Graduates |
|---|---|
| Bachelor’s | 13 |
| Master’s | 15 |
In the most recent year for which we have data, Butler University handed out 13 bachelor’s degrees in music.
Butler University is among the very best schools in the country for music at the bachelor’s level. Specifically, it ranked #1 out of 6 schools by College Factual.
| Ranking | Rank |
|---|---|
| Best Music Bachelor’s Degree Schools in Indiana | 1 |
| Best Music Bachelor’s Degree Schools in the Great Lakes Region | 10 |
| Best Music Bachelor’s Degree Schools | 83 |
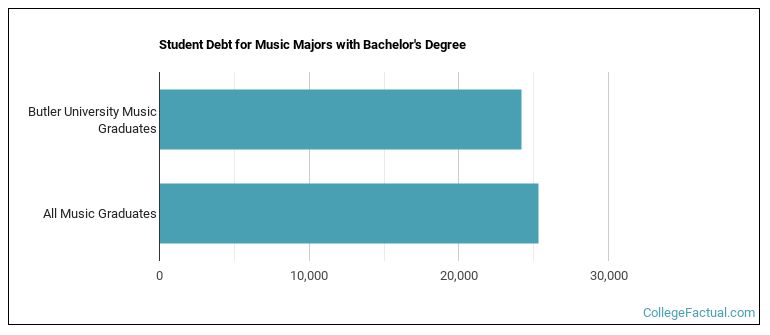
While getting their bachelor’s degree at Butler University, music students accumulate a median of $24,170 in student loans. This is below $25,351, the typical median for all majors at Butler University.
Information about average full-time undergraduate tuition and fees is shown in the table below.
| In State | Out of State | |
|---|---|---|
| Tuition | $42,410 | $46,570 |
| Fees | $990 | $990 |
Find out more about Butler University tuition and fees.
Among recent graduates, 46% of music bachelor’s degrees went to men and 54% went to women.
 The majority of music bachelor’s degree graduates at Butler University were White. About 62% of graduates fell into this category.
The following table and chart show the ethnic background for students who recently graduated from Butler University with a bachelor’s in music.
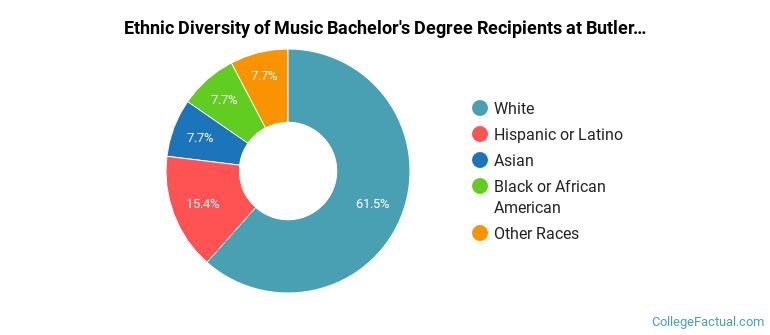
| Ethnic Background | Number of Students |
|---|---|
| Asian | 1 |
| Black or African American | 1 |
| Hispanic or Latino | 2 |
| White | 8 |
| Non-Resident Aliens | 0 |
| Other Races | 1 |
Butler University granted 6 bachelor’s completions in music performance, general in the most recent reporting year — 67% to women and 33% to men. Most of these graduates identified as White (67%).
Butler University conferred 3 bachelor’s completions in music theory and composition in the most recent reporting year — 0% to women and 100% to men. The largest share of these graduates were White (67%).
This program is also offered at the graduate level at Butler University. Annual graduate completions by level are shown below.
| Graduate Level | Annual Graduates |
|---|---|
| Master’s Degrees in Music | 15 |