Butler total enrollment is approximately 5,544 students. 4,347 are undergraduates and 468 are graduate students.
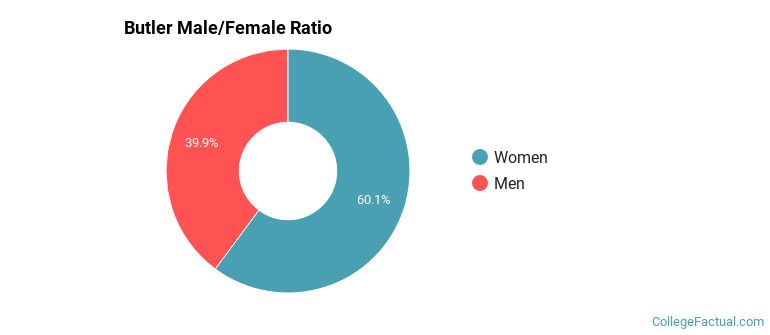
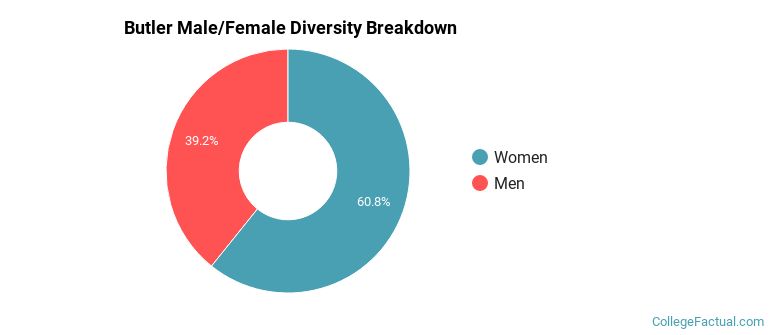
Male/Female Breakdown of Undergraduates
The full-time Butler undergraduate population is made up of 60% women, and 40% men.
For the gender breakdown for all students, go here.
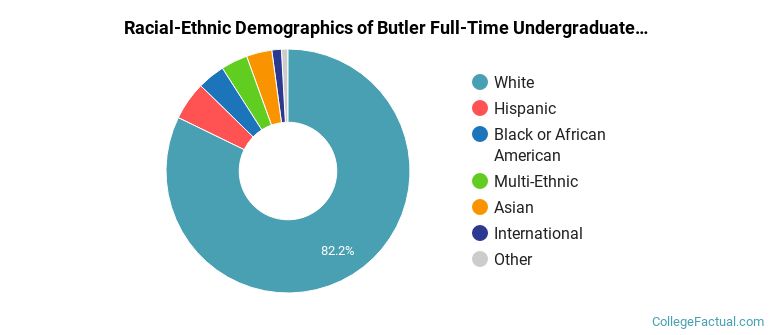
Butler Racial/Ethnic Breakdown of Undergraduates
| Race/Ethnicity | Number |
|---|---|
| White | 3,585 |
| Hispanic | 246 |
| Black or African American | 157 |
| Multi-Ethnic | 151 |
| Asian | 142 |
| International | 32 |
| Unknown | 25 |
| Native Hawaiian or Pacific Islander | 0 |
See racial/ethnic breakdown for all students.
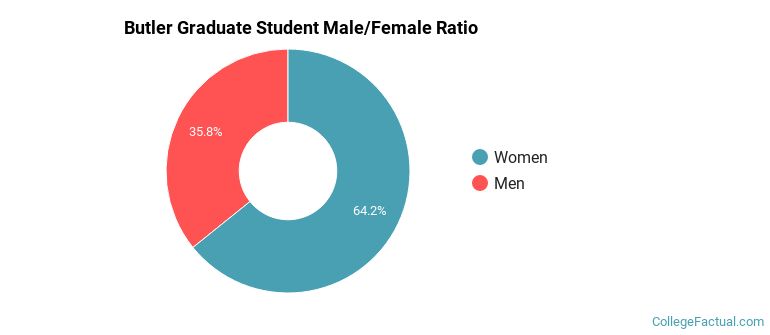
Male/Female Breakdown of Graduate Students
About 64% of full-time grad students are women, and 36% men.
For the gender breakdown for all students, go here.
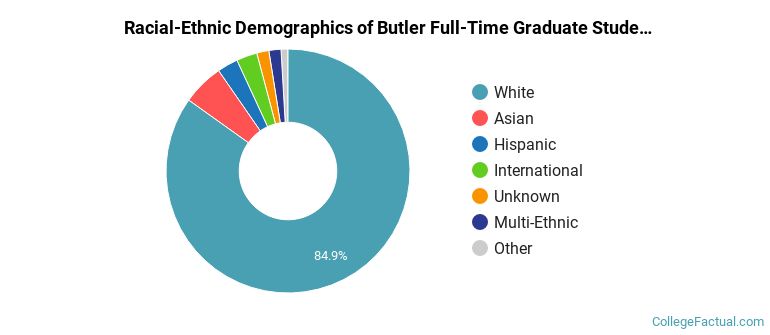
Butler Racial-Ethnic Breakdown of Graduate Students
| Race/Ethnicity | Number |
|---|---|
| White | 383 |
| Asian | 30 |
| Hispanic | 19 |
| International | 12 |
| Black or African American | 11 |
| Multi-Ethnic | 7 |
| Unknown | 6 |
| Native Hawaiian or Pacific Islander | 0 |
See racial/ethnic breakdown for all students.

| Race/Ethnicity | Number |
|---|---|
| White | 4,592 |
| Hispanic | 302 |
| Black or African American | 189 |
| Asian | 184 |
| Multi-Ethnic | 168 |
| Unknown | 52 |
| International | 47 |
| Native Hawaiian or Pacific Islander | 0 |
There are approximately 3,398 female students and 2,146 male students at Butler.
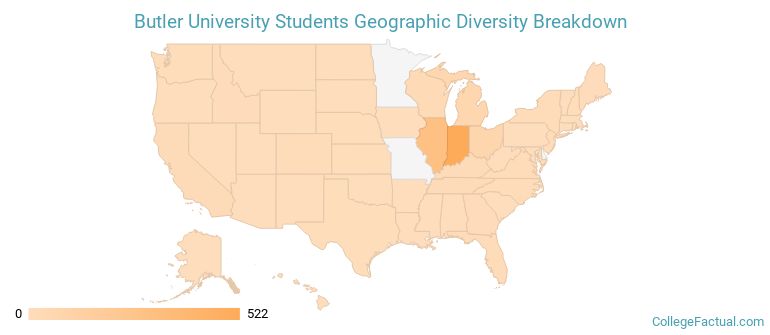
Butler ranks 341 out of 2,183 when it comes to geographic diversity.
57.04% of Butler students come from out of state, and 2.39% come from out of the country.
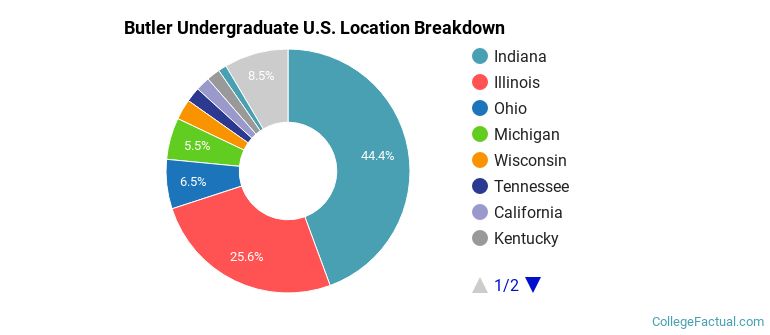
The undergraduate student body is split among 33 states (may include Washington D.C.). Click on the map for more detail.
| State | Amount |
|---|---|
| Indiana | 522 |
| Illinois | 301 |
| Ohio | 77 |
| Michigan | 65 |
| Wisconsin | 32 |
Students from 33 countries are represented at this school, with the majority of the international students coming from United Kingdom, India, and Canada.
Learn more about international students at Butler.
A traditional college student is defined as being between the ages of 18-21. At Butler, 71.25% of students fall into that category, compared to the national average of 60%.
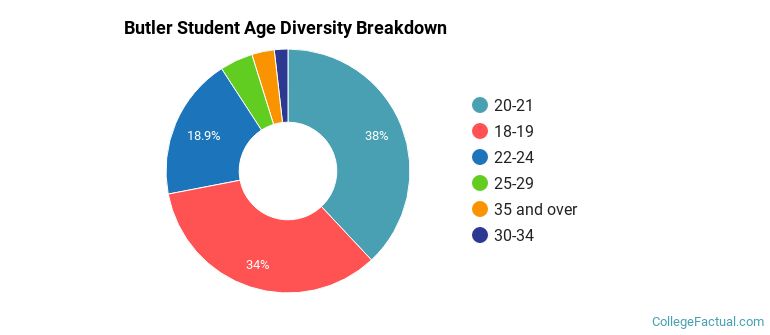
| Student Age Group | Amount |
|---|---|
| 20-21 | 1,936 |
| 18-19 | 1,730 |
| 22-24 | 961 |
| 25-29 | 223 |
| 35 and over | 152 |
| 30-34 | 92 |
| Under 18 | 0 |
Footnotes
*The racial-ethnic minorities count is calculated by taking the total number of students and subtracting white students, international students, and students whose race/ethnicity was unknown. This number is then divided by the total number of students at the school to obtain the racial-ethnic minorities percentage.
References
Department of Homeland Security Citizenship and Immigration Services
Image Credit: By Peetlesnumber1 under License