Cabrini University total enrollment is approximately 2,009 students. 1,463 are undergraduates and 107 are graduate students.
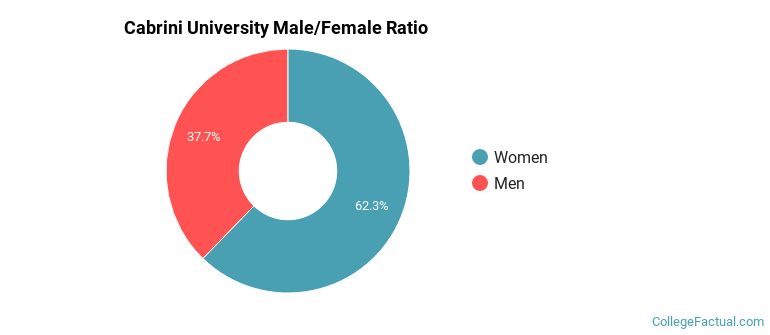
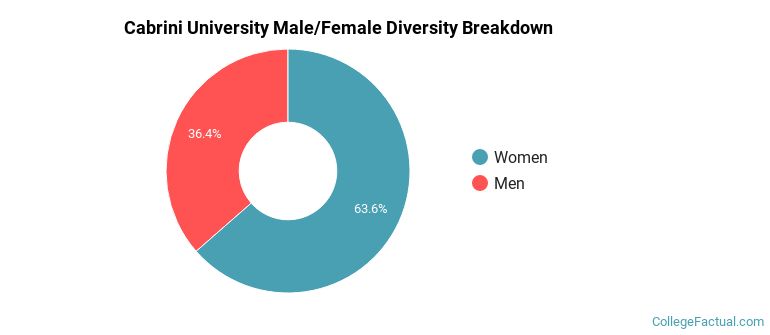
Male/Female Breakdown of Undergraduates
The full-time Cabrini University undergraduate population is made up of 61% women, and 39% men.
For the gender breakdown for all students, go here.
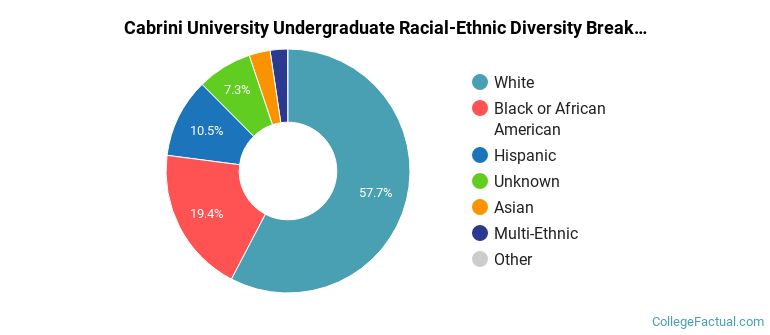
Cabrini University Racial/Ethnic Breakdown of Undergraduates
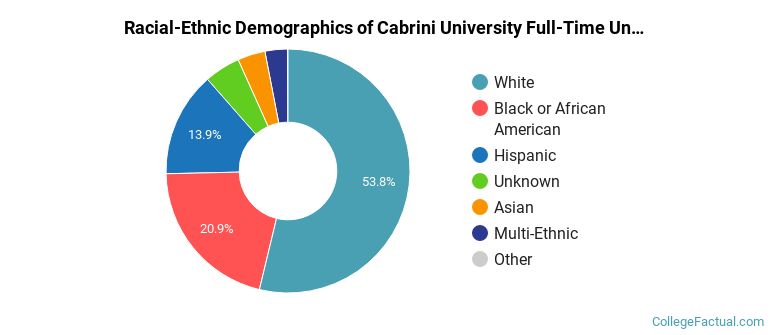
| Race/Ethnicity | Number |
|---|---|
| White | 810 |
| Black or African American | 305 |
| Hispanic | 187 |
| Unknown | 80 |
| Multi-Ethnic | 41 |
| Asian | 39 |
| Native Hawaiian or Pacific Islander | 0 |
| International | 0 |
See racial/ethnic breakdown for all students.
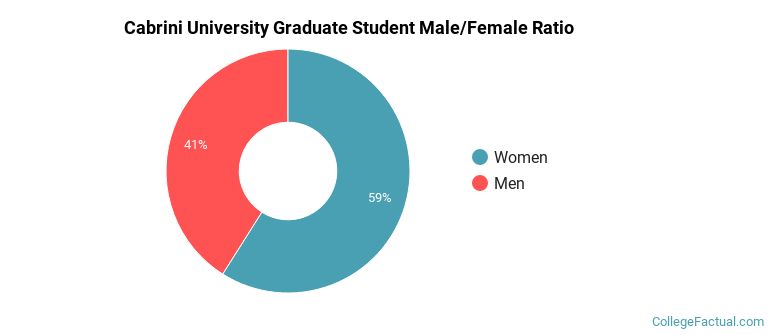
Male/Female Breakdown of Graduate Students
About 68% of full-time grad students are women, and 32% men.
For the gender breakdown for all students, go here.
Cabrini University Racial-Ethnic Breakdown of Graduate Students
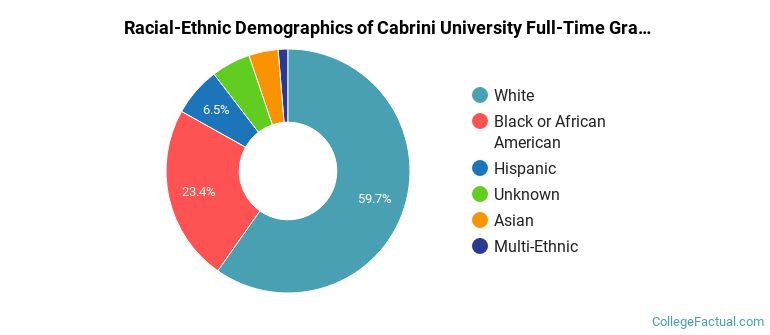
| Race/Ethnicity | Number |
|---|---|
| White | 65 |
| Black or African American | 17 |
| Unknown | 11 |
| Hispanic | 8 |
| Asian | 2 |
| Multi-Ethnic | 2 |
| Native Hawaiian or Pacific Islander | 1 |
| International | 0 |
See racial/ethnic breakdown for all students.
| Race/Ethnicity | Number |
|---|---|
| White | 1,172 |
| Black or African American | 388 |
| Hispanic | 217 |
| Unknown | 121 |
| Multi-Ethnic | 61 |
| Asian | 46 |
| Native Hawaiian or Pacific Islander | 1 |
| International | 0 |
There are approximately 1,272 female students and 737 male students at Cabrini University.
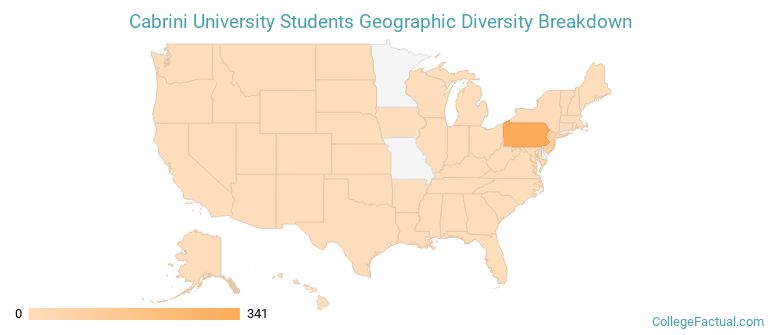
Cabrini University ranks 1,243 out of 2,183 when it comes to geographic diversity.
28.96% of Cabrini University students come from out of state, and 0% come from out of the country.
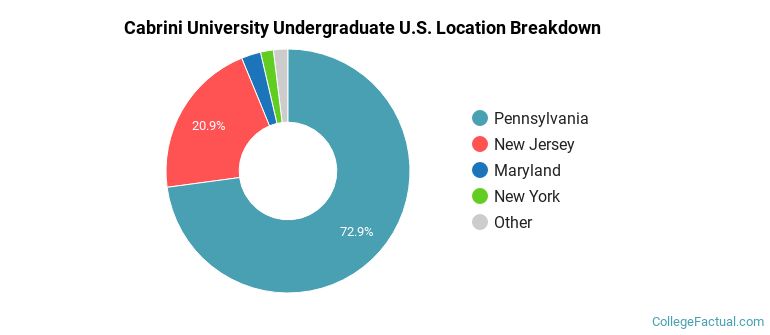
The undergraduate student body is split among 12 states (may include Washington D.C.). Click on the map for more detail.
| State | Amount |
|---|---|
| Pennsylvania | 341 |
| New Jersey | 98 |
| Maryland | 12 |
| New York | 8 |
| Florida | 2 |
A traditional college student is defined as being between the ages of 18-21. At Cabrini University, 57.83% of students fall into that category, compared to the national average of 60%.
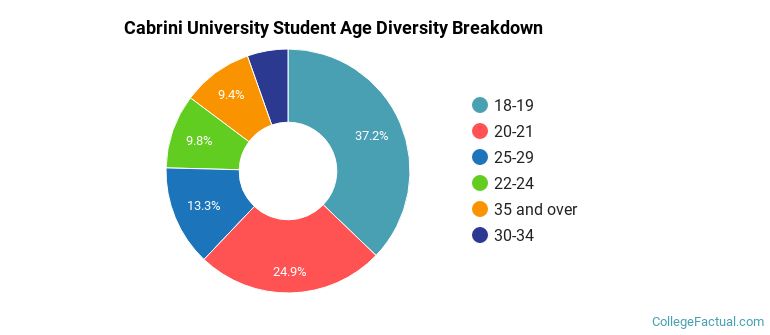
| Student Age Group | Amount |
|---|---|
| 18-19 | 798 |
| 20-21 | 535 |
| 25-29 | 286 |
| 22-24 | 211 |
| 35 and over | 201 |
| 30-34 | 116 |
| Under 18 | 0 |
Footnotes
*The racial-ethnic minorities count is calculated by taking the total number of students and subtracting white students, international students, and students whose race/ethnicity was unknown. This number is then divided by the total number of students at the school to obtain the racial-ethnic minorities percentage.
References
Department of Homeland Security Citizenship and Immigration Services
Image Credit: By User:Smallbones under License