We've gathered data and other essential information about the program, such as the ethnicity of students, how many students graduated in recent times, and more. In addition, we cover how Caltech ranks in comparison to other schools with bio engineering programs.
Jump to any of the following sections:
The bio engineering major at Caltech is not ranked on College Factual’s Best Colleges and Universities for Biomedical Engineering. This could be for a number of reasons, such as not having enough data on the major or school to make an accurate assessment of its quality.
During the 2021-2022 academic year, California Institute of Technology handed out 10 bachelor's degrees in biomedical engineering. Last year, the same number of degrees were handed out.
In 2022, 2 students received their master’s degree in bio engineering from Caltech. This makes it the #137 most popular school for bio engineering master’s degree candidates in the country.
In addition, 11 students received their doctoral degrees in bio engineering in 2022, making the school the #38 most popular school in the United States for this category of students.
The following table shows the average full-time tuition and fees for undergraduates.
| In State | Out of State | |
|---|---|---|
| Tuition | $60,816 | $60,816 |
| Fees | $2,439 | $2,439 |
| Books and Supplies | $1,428 | $1,428 |
| On Campus Room and Board | $19,503 | $19,503 |
| On Campus Other Expenses | $2,700 | $2,700 |
Learn more about Caltech tuition and fees.
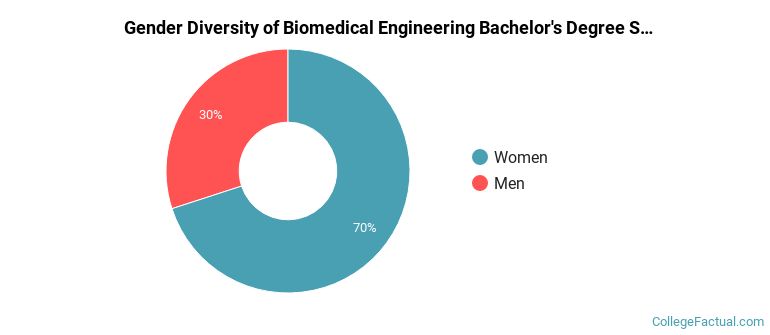
During the 2021-2022 academic year, 10 bio engineering majors earned their bachelor's degree from Caltech. Of these graduates, 30% were men and 70% were women.
The majority of the graduates for this major are Asian American. In the graduating class of 2022, 70% of grads fell into this category.
The following table and chart show the ethnic background for students who recently graduated from California Institute of Technology with a bachelor's in bio engineering.
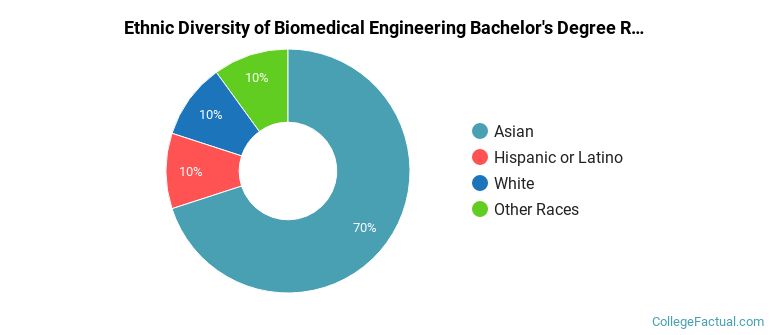
| Ethnic Background | Number of Students |
|---|---|
| Asian | 7 |
| Black or African American | 0 |
| Hispanic or Latino | 1 |
| White | 1 |
| Non-Resident Aliens | 0 |
| Other Races | 1 |
Online degrees for the Caltech bio engineering bachelor’s degree program are not available at this time. To see if the school offers distance learning options in other areas, visit the Caltech Online Learning page.
Take a look at the following statistics related to the make-up of the bio engineering majors at California Institute of Technology.
| Related Major | Annual Graduates |
|---|---|
| Mechanical Engineering | 50 |
| Electrical Engineering | 42 |
| Aerospace & Aeronautical Engineering | 31 |
| Engineering Physics | 30 |
| Chemical Engineering | 23 |
More about our data sources and methodologies.