CSUB total enrollment is approximately 11,745 students. 8,432 are undergraduates and 1,321 are graduate students.
Male/Female Breakdown of Undergraduates
The full-time CSUB undergraduate population is made up of 65% women, and 35% men.

For the gender breakdown for all students, go here.
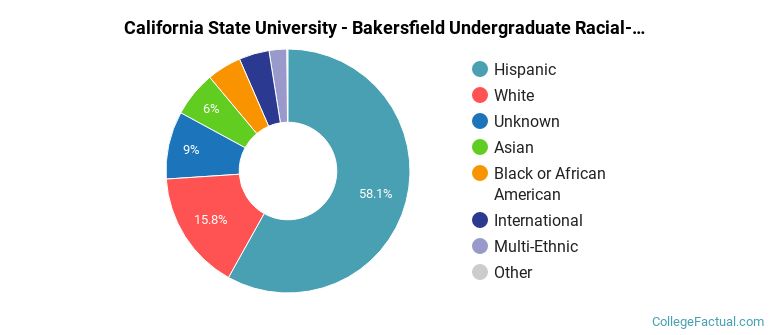
CSUB Racial/Ethnic Breakdown of Undergraduates

| Race/Ethnicity | Number |
|---|---|
| Hispanic | 5,330 |
| White | 1,130 |
| Asian | 539 |
| Unknown | 508 |
| International | 364 |
| Black or African American | 337 |
| Multi-Ethnic | 184 |
| Native Hawaiian or Pacific Islander | 18 |
See racial/ethnic breakdown for all students.
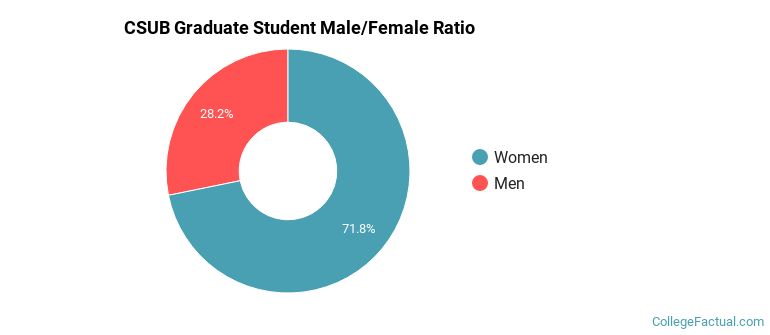
Male/Female Breakdown of Graduate Students
About 75% of full-time grad students are women, and 25% men.
For the gender breakdown for all students, go here.
CSUB Racial-Ethnic Breakdown of Graduate Students

| Race/Ethnicity | Number |
|---|---|
| Hispanic | 786 |
| White | 283 |
| Unknown | 79 |
| Asian | 65 |
| Black or African American | 36 |
| Multi-Ethnic | 35 |
| International | 30 |
| Native Hawaiian or Pacific Islander | 0 |
See racial/ethnic breakdown for all students.
| Race/Ethnicity | Number |
|---|---|
| Hispanic | 7,160 |
| White | 1,799 |
| Unknown | 774 |
| Asian | 725 |
| Black or African American | 492 |
| International | 469 |
| Multi-Ethnic | 269 |
| Native Hawaiian or Pacific Islander | 22 |

There are approximately 7,752 female students and 3,993 male students at CSUB.
CSUB ranks 1,662 out of 2,183 when it comes to geographic diversity.
1.71% of CSUB students come from out of state, and 1.25% come from out of the country.
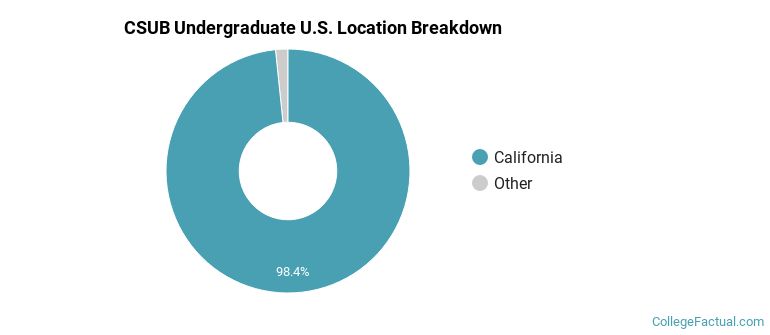
The undergraduate student body is split among 15 states (may include Washington D.C.). Click on the map for more detail.
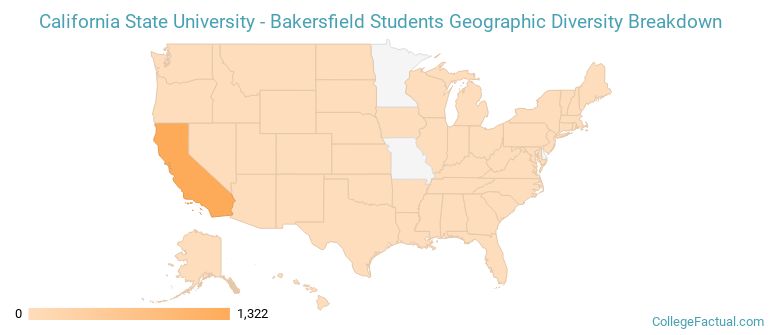
| State | Amount |
|---|---|
| California | 1,322 |
| Arizona | 4 |
| Colorado | 3 |
| Hawaii | 2 |
| Utah | 2 |
Learn more about international students at CSUB.
A traditional college student is defined as being between the ages of 18-21. At CSUB, 46.22% of students fall into that category, compared to the national average of 60%.
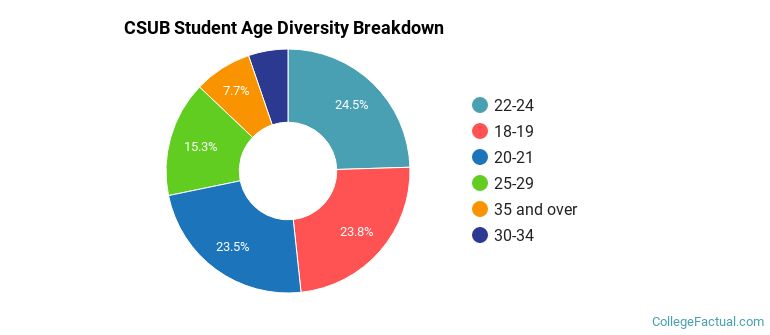
| Student Age Group | Amount |
|---|---|
| 22-24 | 2,429 |
| 18-19 | 2,357 |
| 20-21 | 2,326 |
| 25-29 | 1,518 |
| 35 and over | 760 |
| 30-34 | 520 |
| Under 18 | 0 |
Footnotes
*The racial-ethnic minorities count is calculated by taking the total number of students and subtracting white students, international students, and students whose race/ethnicity was unknown. This number is then divided by the total number of students at the school to obtain the racial-ethnic minorities percentage.
References
Department of Homeland Security Citizenship and Immigration Services
Image Credit: By Bobak Ha’Eri under License
Find out how College Factual created their Diversity Rankings.