CSUDH total enrollment is approximately 18,687 students. 12,451 are undergraduates and 1,439 are graduate students.
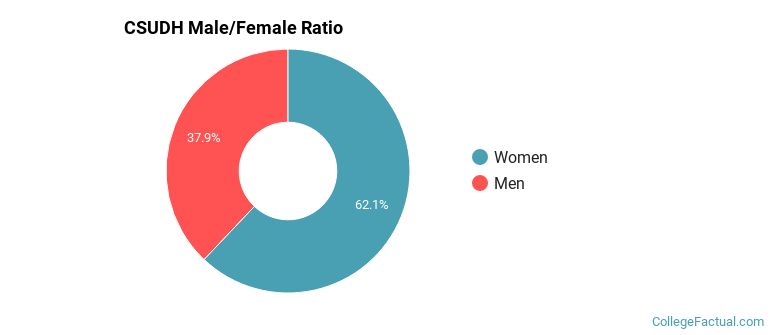
Male/Female Breakdown of Undergraduates
The full-time CSUDH undergraduate population is made up of 64% women, and 36% men.
For the gender breakdown for all students, go here.
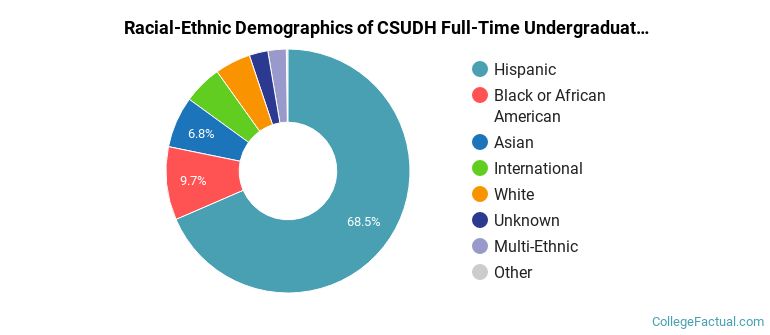
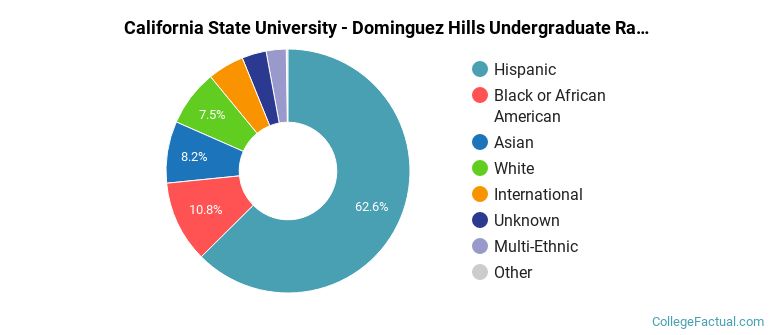
CSUDH Racial/Ethnic Breakdown of Undergraduates
| Race/Ethnicity | Number |
|---|---|
| Hispanic | 8,659 |
| Black or African American | 1,258 |
| Asian | 742 |
| International | 603 |
| White | 583 |
| Unknown | 277 |
| Multi-Ethnic | 275 |
| Native Hawaiian or Pacific Islander | 36 |
See racial/ethnic breakdown for all students.
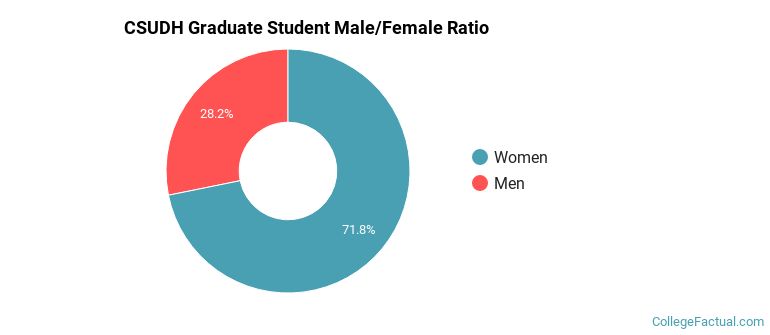
Male/Female Breakdown of Graduate Students
About 74% of full-time grad students are women, and 26% men.
For the gender breakdown for all students, go here.
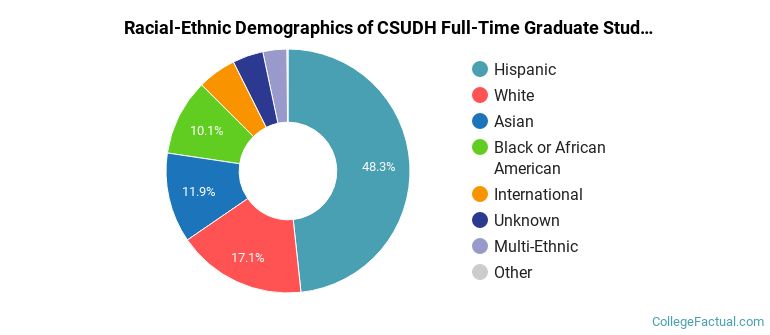
CSUDH Racial-Ethnic Breakdown of Graduate Students
| Race/Ethnicity | Number |
|---|---|
| Hispanic | 718 |
| White | 232 |
| Asian | 174 |
| Black or African American | 129 |
| Unknown | 77 |
| International | 64 |
| Multi-Ethnic | 40 |
| Native Hawaiian or Pacific Islander | 3 |
See racial/ethnic breakdown for all students.
| Race/Ethnicity | Number |
|---|---|
| Hispanic | 11,956 |
| Black or African American | 2,018 |
| Asian | 1,434 |
| White | 1,322 |
| International | 860 |
| Unknown | 566 |
| Multi-Ethnic | 454 |
| Native Hawaiian or Pacific Islander | 54 |

There are approximately 12,027 female students and 6,660 male students at CSUDH.
CSUDH ranks 1,969 out of 2,183 when it comes to geographic diversity.
0.15% of CSUDH students come from out of state, and 0.38% come from out of the country.

The undergraduate student body is split among 3 states (may include Washington D.C.). Click on the map for more detail.
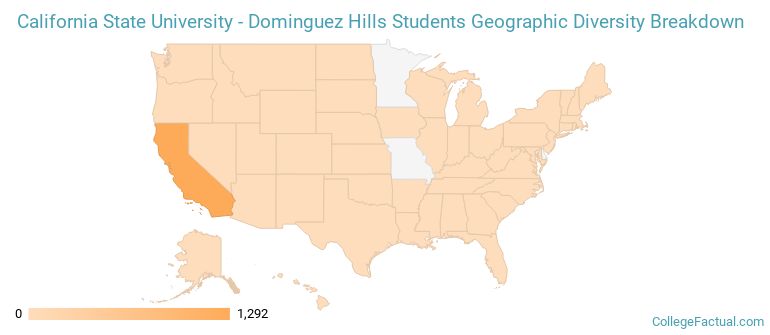
| State | Amount |
|---|---|
| California | 1,292 |
| Arizona | 1 |
| Oregon | 1 |
| Alaska | 0 |
| Alabama | 0 |
Learn more about international students at CSUDH.
A traditional college student is defined as being between the ages of 18-21. At CSUDH, 29.46% of students fall into that category, compared to the national average of 60%.
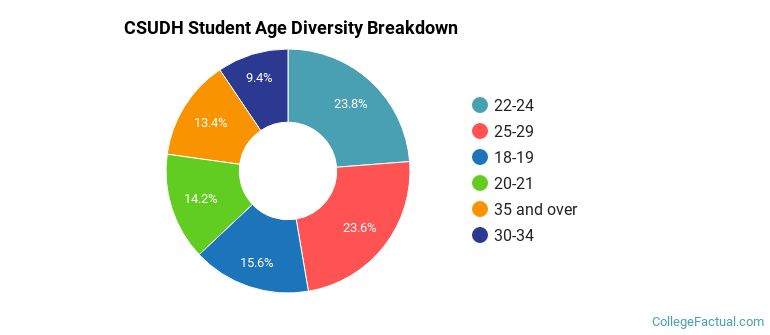
| Student Age Group | Amount |
|---|---|
| 22-24 | 3,802 |
| 25-29 | 3,768 |
| 18-19 | 2,503 |
| 20-21 | 2,275 |
| 35 and over | 2,137 |
| 30-34 | 1,511 |
| Under 18 | 0 |
Footnotes
*The racial-ethnic minorities count is calculated by taking the total number of students and subtracting white students, international students, and students whose race/ethnicity was unknown. This number is then divided by the total number of students at the school to obtain the racial-ethnic minorities percentage.
References
Department of Homeland Security Citizenship and Immigration Services
Find out how College Factual created their Diversity Rankings.