Fresno State total enrollment is approximately 25,497 students. 19,297 are undergraduates and 1,916 are graduate students.
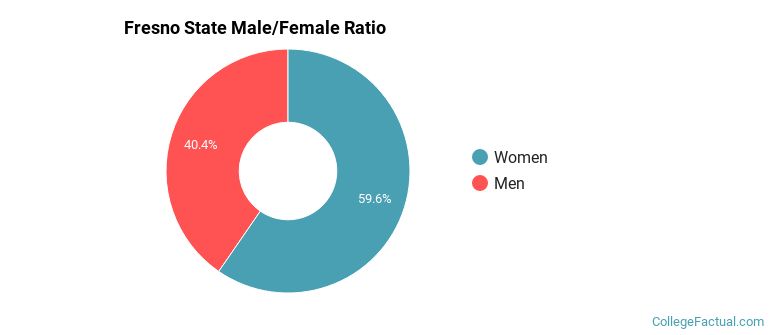
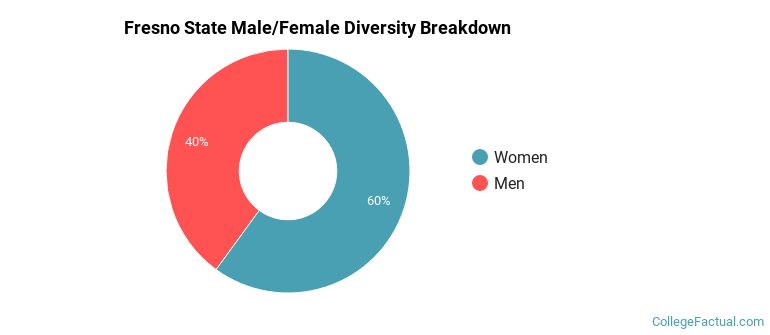
Male/Female Breakdown of Undergraduates
The full-time Fresno State undergraduate population is made up of 60% women, and 40% men.
For the gender breakdown for all students, go here.
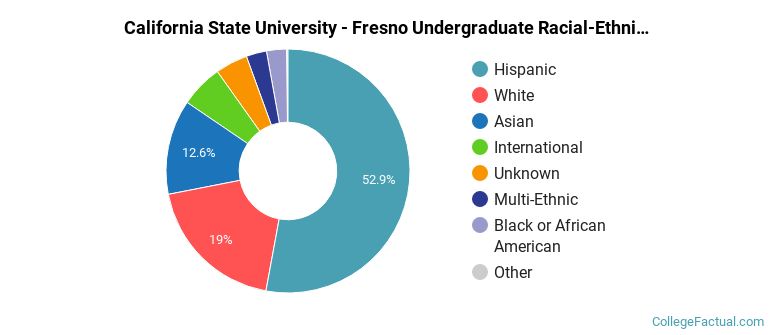
Fresno State Racial/Ethnic Breakdown of Undergraduates
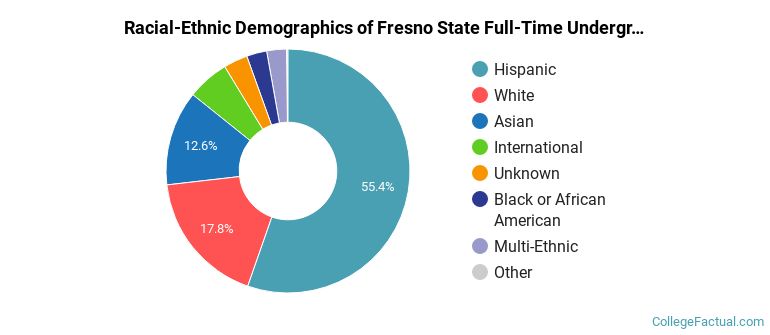
| Race/Ethnicity | Number |
|---|---|
| Hispanic | 10,983 |
| White | 3,324 |
| Asian | 2,384 |
| International | 947 |
| Black or African American | 530 |
| Unknown | 521 |
| Multi-Ethnic | 502 |
| Native Hawaiian or Pacific Islander | 36 |
See racial/ethnic breakdown for all students.
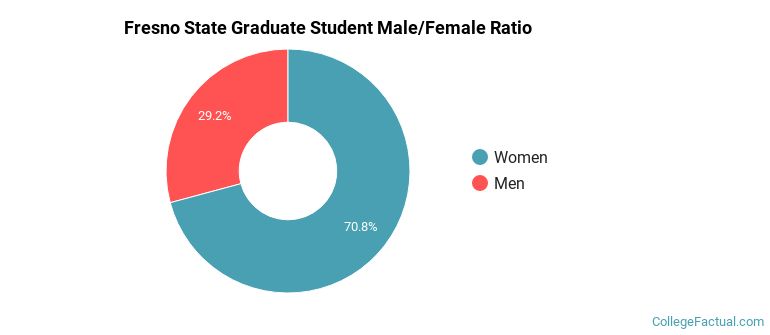
Male/Female Breakdown of Graduate Students
About 70% of full-time grad students are women, and 30% men.
For the gender breakdown for all students, go here.
Fresno State Racial-Ethnic Breakdown of Graduate Students
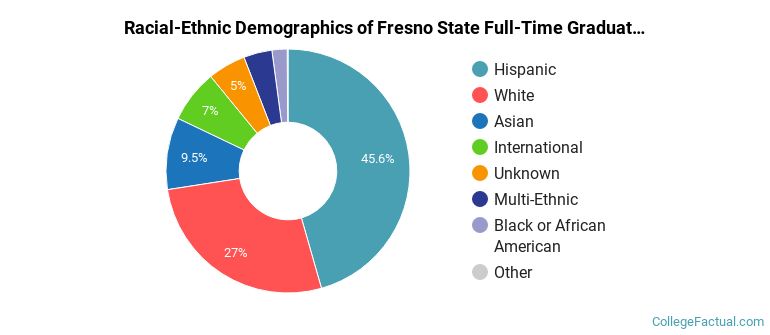
| Race/Ethnicity | Number |
|---|---|
| Hispanic | 902 |
| White | 485 |
| Asian | 192 |
| International | 114 |
| Unknown | 90 |
| Multi-Ethnic | 67 |
| Black or African American | 46 |
| Native Hawaiian or Pacific Islander | 8 |
See racial/ethnic breakdown for all students.
| Race/Ethnicity | Number |
|---|---|
| Hispanic | 13,939 |
| White | 4,670 |
| Asian | 3,084 |
| International | 1,278 |
| Unknown | 978 |
| Black or African American | 712 |
| Multi-Ethnic | 682 |
| Native Hawaiian or Pacific Islander | 48 |
There are approximately 15,397 female students and 10,100 male students at Fresno State.
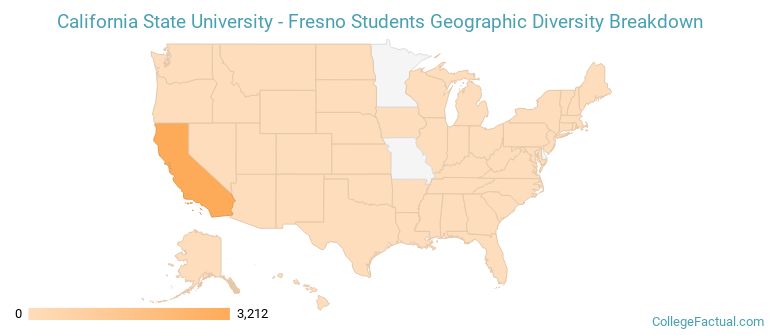
Fresno State ranks 1,732 out of 2,183 when it comes to geographic diversity.
1.02% of Fresno State students come from out of state, and 1.7% come from out of the country.
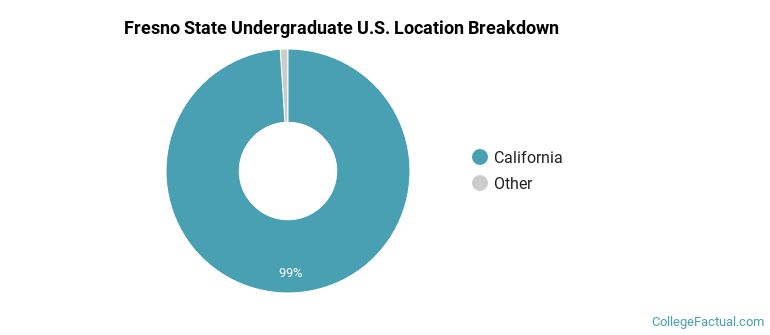
The undergraduate student body is split among 16 states (may include Washington D.C.). Click on the map for more detail.
| State | Amount |
|---|---|
| California | 3,212 |
| Washington | 5 |
| Florida | 4 |
| Texas | 4 |
| Colorado | 3 |
Learn more about international students at Fresno State.
A traditional college student is defined as being between the ages of 18-21. At Fresno State, 48.66% of students fall into that category, compared to the national average of 60%.
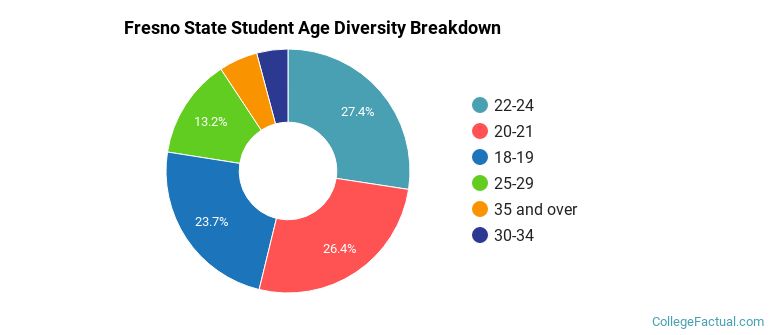
| Student Age Group | Amount |
|---|---|
| 22-24 | 6,747 |
| 20-21 | 6,494 |
| 18-19 | 5,830 |
| 25-29 | 3,258 |
| 35 and over | 1,264 |
| 30-34 | 1,019 |
| Under 18 | 0 |
Footnotes
*The racial-ethnic minorities count is calculated by taking the total number of students and subtracting white students, international students, and students whose race/ethnicity was unknown. This number is then divided by the total number of students at the school to obtain the racial-ethnic minorities percentage.
References
Department of Homeland Security Citizenship and Immigration Services
Image Credit: By Bobak Ha’Eri under License
Learn more about how College Factual creates their Diversity Rankings.