Here is an overview of this program at Cal State Fullerton. Degrees are awarded at the Bachelor’s level, with graduate study also available. Its best result is a rank of #12 out of 62 schools (Bachelor’s level) by College Factual. Jump to any of the following sections:
College Factual ranks Cal State Fullerton among the top schools in the country for general biology, placing at #50 out of 1,257 schools nationally.
| Ranking | Rank |
|---|---|
| Best General Biology Schools | 50 of 1,257 |
| Best General Biology Schools in California | 13 of 141 |
The following degree levels are available for general biology at Cal State Fullerton, along with how many graduates complete each level annually.
| Degree Level | Annual Graduates |
|---|---|
| Bachelor’s | 244 |
| Master’s | 12 |
In the most recent year for which we have data, California State University-Fullerton awarded 244 bachelor’s degrees in general biology.
Cal State Fullerton holds a strong position among schools offering general biology at the bachelor’s level. Specifically, it ranked #12 out of 62 schools by College Factual.
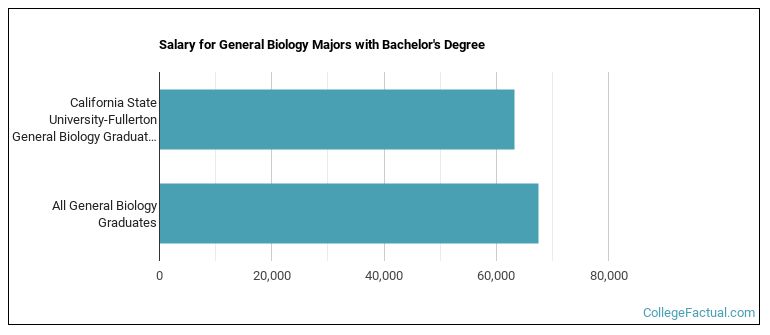
General Biology majors who earn their bachelor’s degree from Cal State Fullerton report a median salary of $63,241 a year. This is lower than $67,546, the median for all majors at Cal State Fullerton.
The full-time undergraduate tuition and fees are shown below.
| In State | Out of State | |
|---|---|---|
| Tuition | $5,742 | $18,684 |
| Fees | $1,386 | $1,386 |
Learn more about Cal State Fullerton tuition and fees.
Among recent graduates, 28% of general biology bachelor’s degrees went to men and 72% went to women.
 The largest share of general biology bachelor’s degree graduates at Cal State Fullerton are Hispanic or Latino. Roughly 41% of graduates fell into this category.
The following table and chart show the ethnic background for students who recently graduated from California State University-Fullerton with a bachelor’s in general biology.
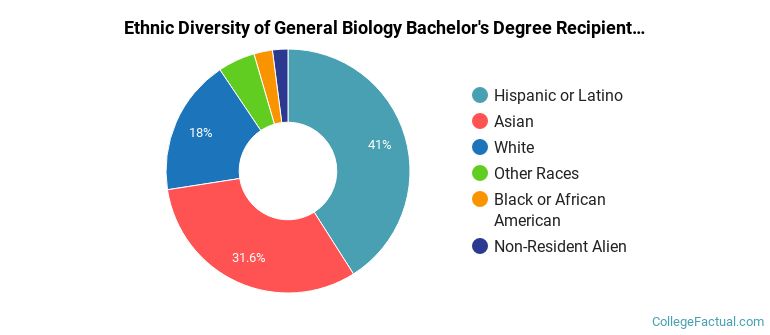
| Ethnic Background | Number of Students |
|---|---|
| Asian | 77 |
| Black or African American | 6 |
| Hispanic or Latino | 100 |
| White | 44 |
| Non-Resident Aliens | 5 |
| Other Races | 12 |
Cal State Fullerton awarded 244 bachelor’s degrees in biology/biological sciences, general in the most recent reporting year — 72% to women and 28% to men. The most common background among these graduates was Hispanic or Latino (41%).
You can also pursue this field at the graduate level at Cal State Fullerton. Annual graduate completions by level are shown below.
| Graduate Level | Annual Graduates |
|---|---|
| Master’s Degrees in General Biology | 12 |