CSUMB total enrollment is approximately 7,409 students. 5,703 are undergraduates and 637 are graduate students.
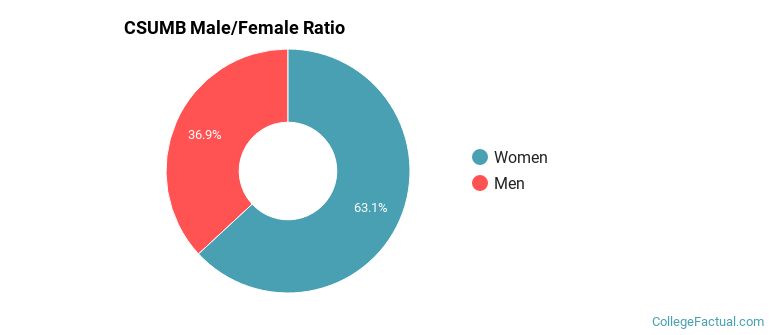
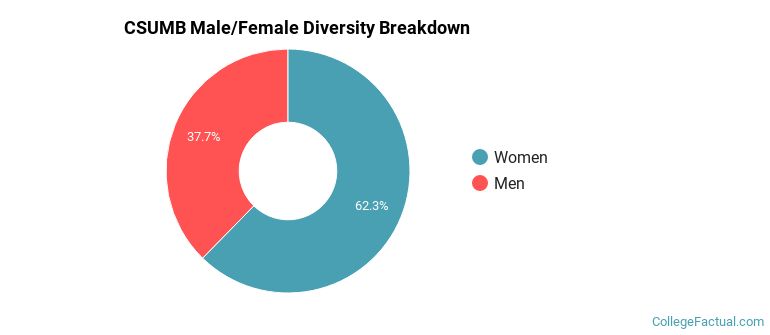
Male/Female Breakdown of Undergraduates
The full-time CSUMB undergraduate population is made up of 64% women, and 36% men.
For the gender breakdown for all students, go here.
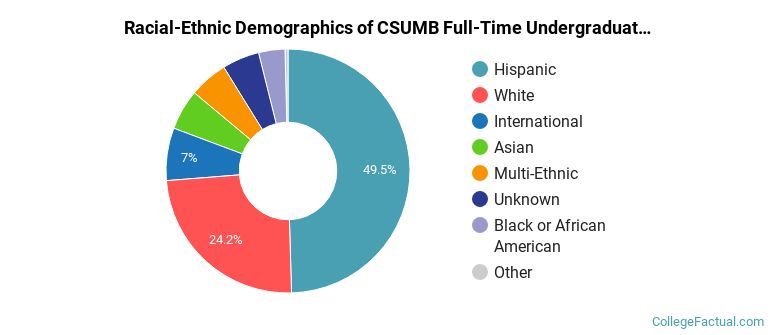
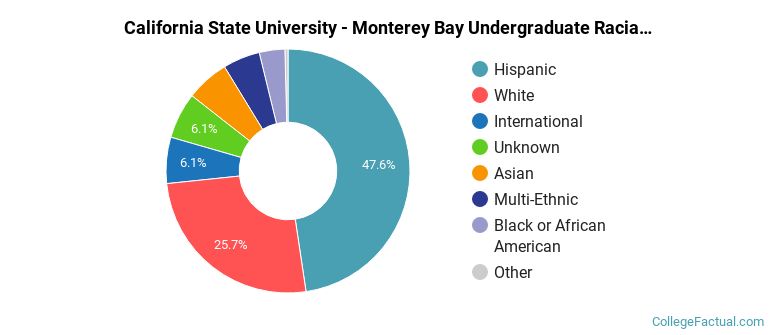
CSUMB Racial/Ethnic Breakdown of Undergraduates
| Race/Ethnicity | Number |
|---|---|
| Hispanic | 2,969 |
| White | 1,364 |
| Asian | 335 |
| Multi-Ethnic | 306 |
| International | 293 |
| Unknown | 217 |
| Black or African American | 188 |
| Native Hawaiian or Pacific Islander | 18 |
See racial/ethnic breakdown for all students.
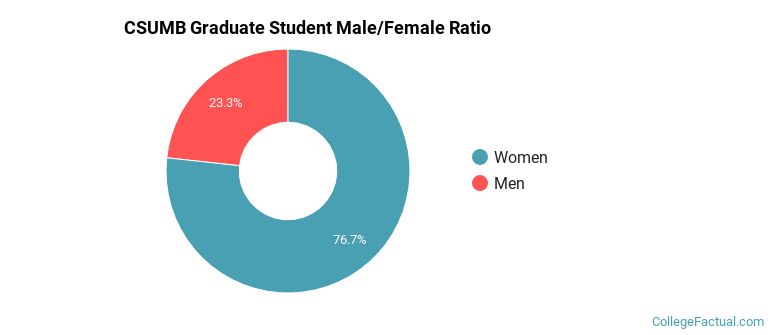
Male/Female Breakdown of Graduate Students
About 72% of full-time grad students are women, and 28% men.
For the gender breakdown for all students, go here.
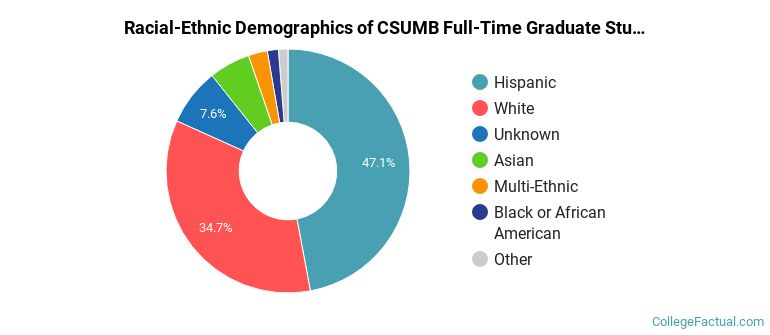
CSUMB Racial-Ethnic Breakdown of Graduate Students
| Race/Ethnicity | Number |
|---|---|
| Hispanic | 276 |
| White | 220 |
| Asian | 48 |
| Unknown | 37 |
| International | 20 |
| Multi-Ethnic | 17 |
| Black or African American | 14 |
| Native Hawaiian or Pacific Islander | 3 |
See racial/ethnic breakdown for all students.
| Race/Ethnicity | Number |
|---|---|
| Hispanic | 3,694 |
| White | 1,932 |
| Asian | 468 |
| Multi-Ethnic | 371 |
| International | 351 |
| Unknown | 320 |
| Black or African American | 227 |
| Native Hawaiian or Pacific Islander | 28 |
There are approximately 4,692 female students and 2,717 male students at CSUMB.
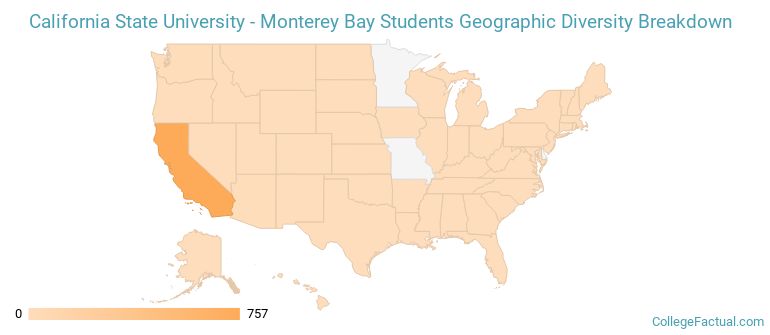
CSUMB ranks 1,465 out of 2,183 when it comes to geographic diversity.
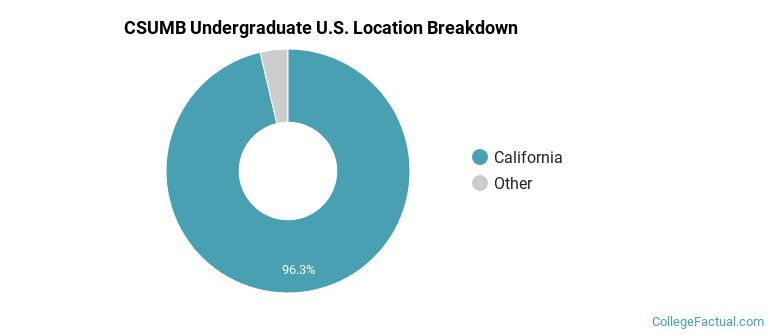
3.81% of CSUMB students come from out of state, and 1.87% come from out of the country.
The undergraduate student body is split among 16 states (may include Washington D.C.). Click on the map for more detail.
| State | Amount |
|---|---|
| California | 757 |
| Arizona | 5 |
| Washington | 4 |
| Colorado | 3 |
| Hawaii | 3 |
Students from 56 countries are represented at this school, with the majority of the international students coming from Japan, China, and Germany.
Learn more about international students at CSUMB.
A traditional college student is defined as being between the ages of 18-21. At CSUMB, 48.35% of students fall into that category, compared to the national average of 60%.
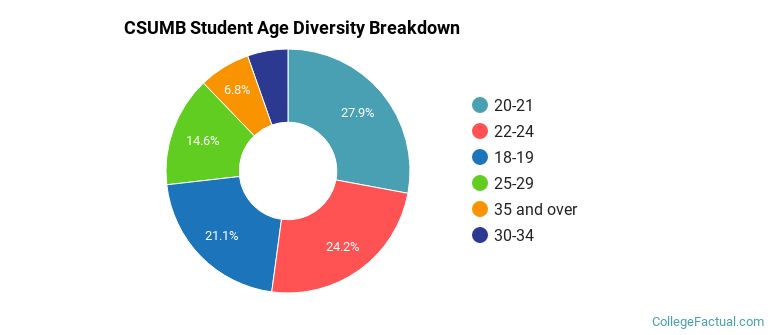
| Student Age Group | Amount |
|---|---|
| 20-21 | 2,090 |
| 22-24 | 1,811 |
| 18-19 | 1,577 |
| 25-29 | 1,094 |
| 35 and over | 510 |
| 30-34 | 402 |
| Under 18 | 0 |
Footnotes
*The racial-ethnic minorities count is calculated by taking the total number of students and subtracting white students, international students, and students whose race/ethnicity was unknown. This number is then divided by the total number of students at the school to obtain the racial-ethnic minorities percentage.
References
Department of Homeland Security Citizenship and Immigration Services
Image Credit: By DirectorG at en.wikipedia under License
Learn more about how College Factual creates their Diversity Rankings.