CSUSM total enrollment is approximately 16,367 students. 12,381 are undergraduates and 979 are graduate students.
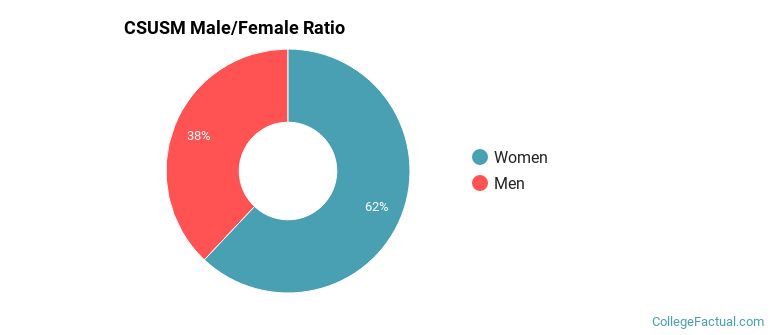
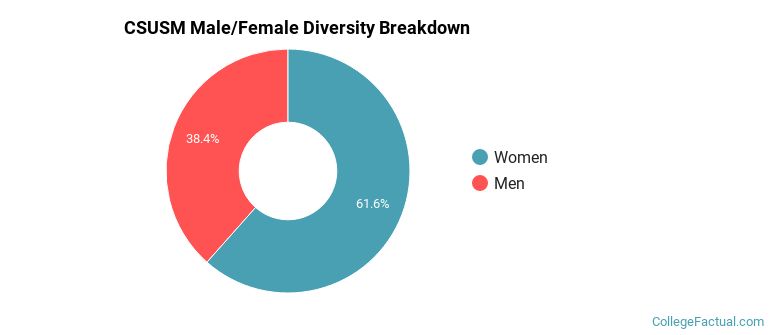
Male/Female Breakdown of Undergraduates
The full-time CSUSM undergraduate population is made up of 63% women, and 37% men.
For the gender breakdown for all students, go here.
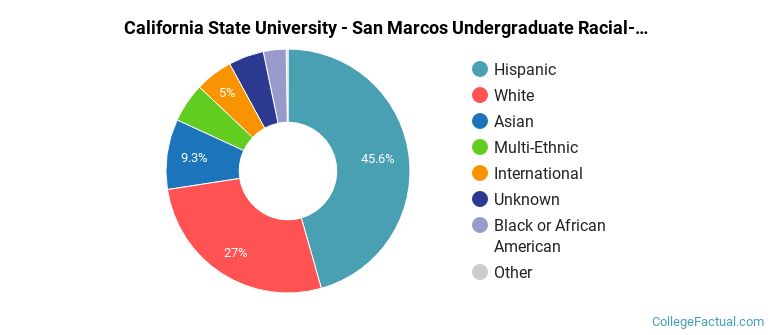
CSUSM Racial/Ethnic Breakdown of Undergraduates
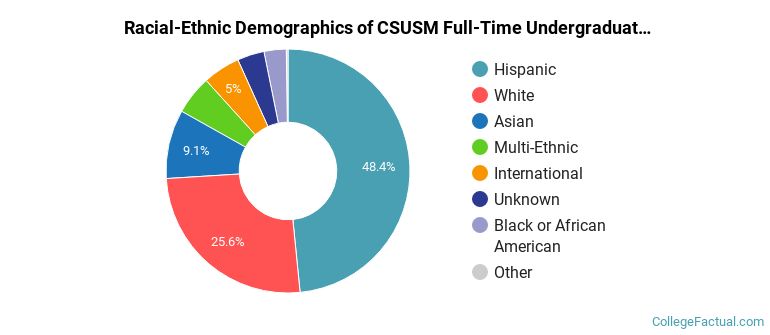
| Race/Ethnicity | Number |
|---|---|
| Hispanic | 6,156 |
| White | 3,195 |
| Asian | 1,126 |
| Multi-Ethnic | 640 |
| International | 441 |
| Black or African American | 386 |
| Unknown | 383 |
| Native Hawaiian or Pacific Islander | 29 |
See racial/ethnic breakdown for all students.
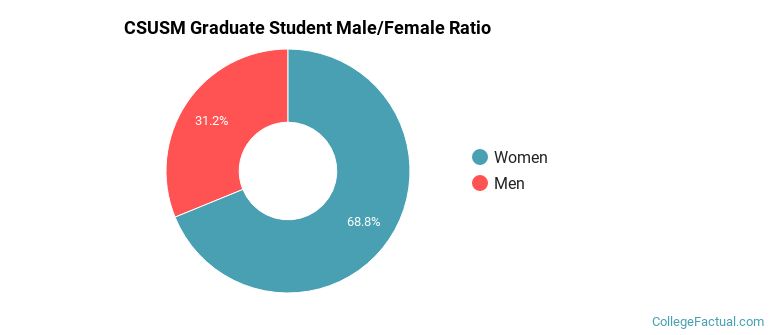
Male/Female Breakdown of Graduate Students
About 71% of full-time grad students are women, and 29% men.
For the gender breakdown for all students, go here.
CSUSM Racial-Ethnic Breakdown of Graduate Students
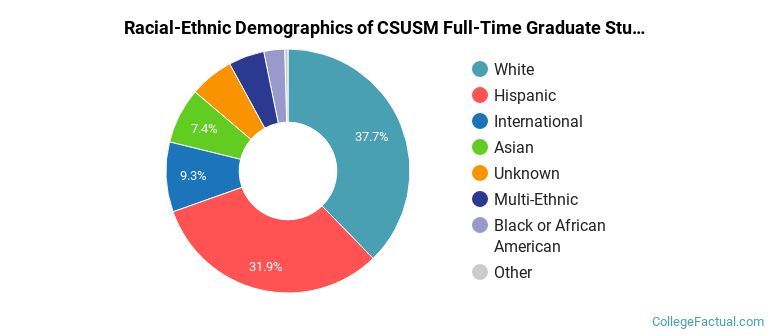
| Race/Ethnicity | Number |
|---|---|
| White | 367 |
| Hispanic | 334 |
| Asian | 79 |
| International | 56 |
| Unknown | 50 |
| Multi-Ethnic | 48 |
| Black or African American | 40 |
| Native Hawaiian or Pacific Islander | 4 |
See racial/ethnic breakdown for all students.
| Race/Ethnicity | Number |
|---|---|
| Hispanic | 7,714 |
| White | 4,457 |
| Asian | 1,533 |
| Multi-Ethnic | 843 |
| International | 624 |
| Unknown | 591 |
| Black or African American | 528 |
| Native Hawaiian or Pacific Islander | 44 |
There are approximately 10,145 female students and 6,222 male students at CSUSM.
CSUSM ranks 1,460 out of 2,183 when it comes to geographic diversity.
2.04% of CSUSM students come from out of state, and 2% come from out of the country.
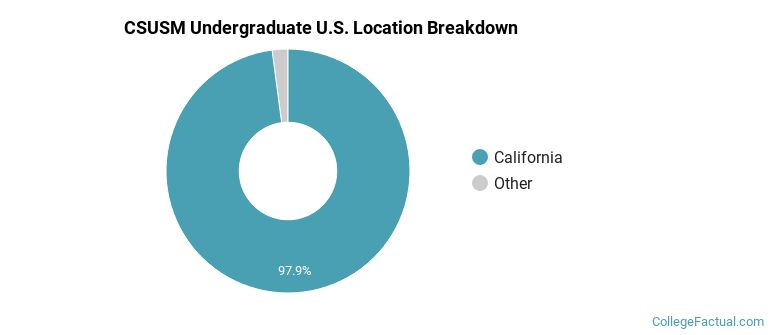
The undergraduate student body is split among 23 states (may include Washington D.C.). Click on the map for more detail.
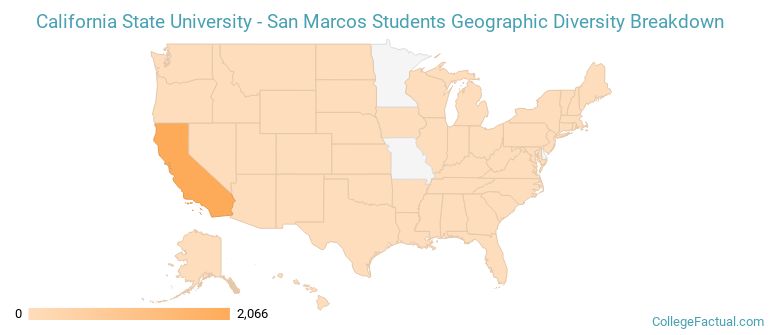
| State | Amount |
|---|---|
| California | 2,066 |
| Arizona | 5 |
| Colorado | 5 |
| Washington | 5 |
| Alaska | 4 |
Students from 56 countries are represented at this school, with the majority of the international students coming from China, Japan, and Saudi Arabia.
Learn more about international students at CSUSM.
A traditional college student is defined as being between the ages of 18-21. At CSUSM, 48.36% of students fall into that category, compared to the national average of 60%.
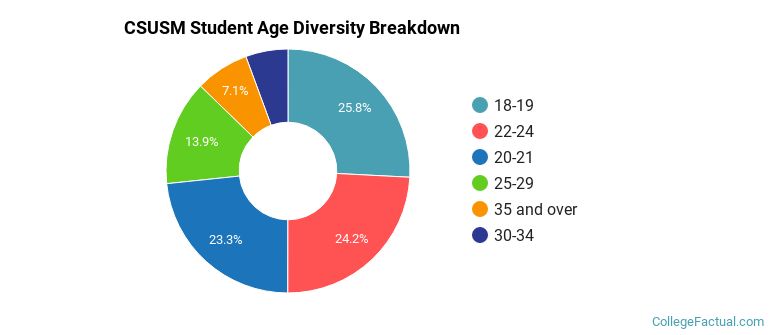
| Student Age Group | Amount |
|---|---|
| 18-19 | 4,003 |
| 22-24 | 3,754 |
| 20-21 | 3,616 |
| 25-29 | 2,158 |
| 35 and over | 1,105 |
| 30-34 | 871 |
| Under 18 | 0 |
Footnotes
*The racial-ethnic minorities count is calculated by taking the total number of students and subtracting white students, international students, and students whose race/ethnicity was unknown. This number is then divided by the total number of students at the school to obtain the racial-ethnic minorities percentage.
References
Department of Homeland Security Citizenship and Immigration Services
Image Credit: By Eamuscatuli under License
Read College Factual's Diversity Ranking Methodology.