Campbell total enrollment is approximately 5,964 students. 3,098 are undergraduates and 1,963 are graduate students.
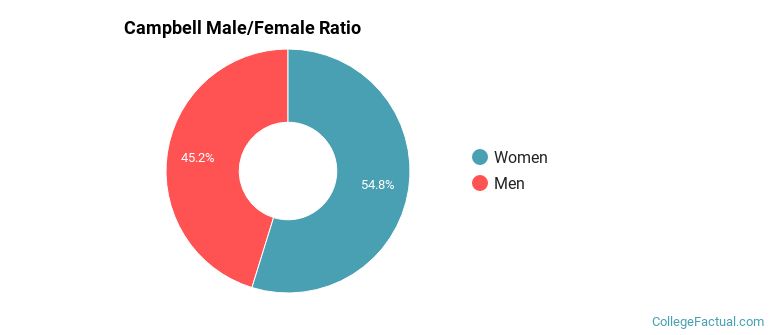
Male/Female Breakdown of Undergraduates
The full-time Campbell undergraduate population is made up of 55% women, and 45% men.
For the gender breakdown for all students, go here.
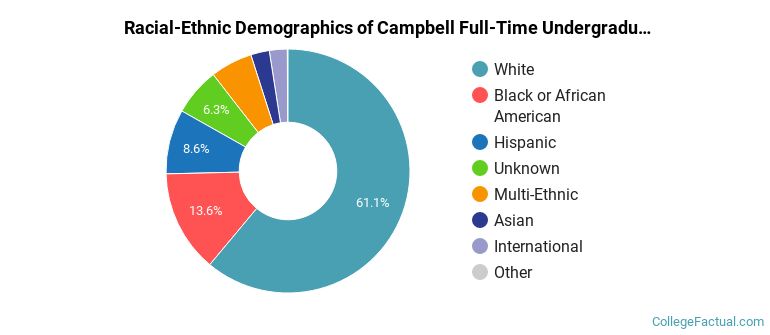
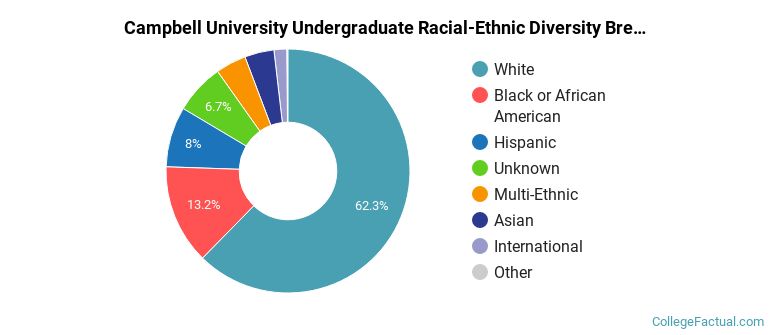
Campbell Racial/Ethnic Breakdown of Undergraduates
| Race/Ethnicity | Number |
|---|---|
| White | 1,922 |
| Black or African American | 448 |
| Hispanic | 282 |
| Multi-Ethnic | 164 |
| Unknown | 119 |
| International | 81 |
| Asian | 68 |
| Native Hawaiian or Pacific Islander | 8 |
See racial/ethnic breakdown for all students.
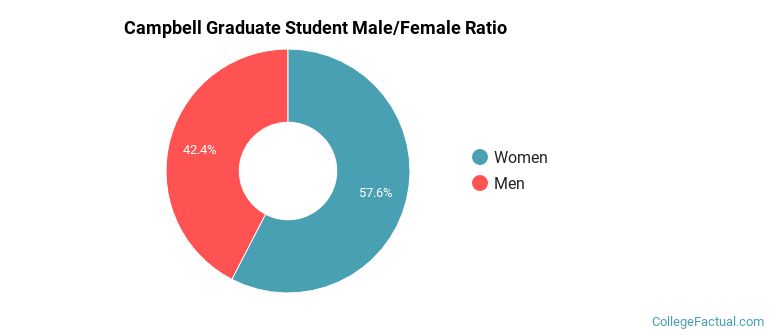
Male/Female Breakdown of Graduate Students
About 60% of full-time grad students are women, and 40% men.
For the gender breakdown for all students, go here.
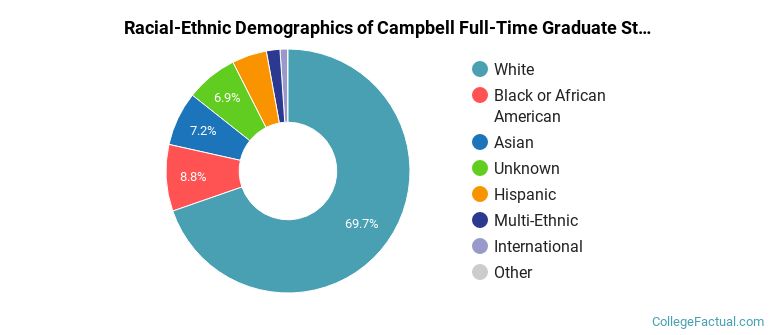
Campbell Racial-Ethnic Breakdown of Graduate Students
| Race/Ethnicity | Number |
|---|---|
| White | 1,303 |
| Black or African American | 176 |
| Asian | 159 |
| Unknown | 153 |
| Hispanic | 112 |
| Multi-Ethnic | 42 |
| International | 11 |
| Native Hawaiian or Pacific Islander | 2 |
See racial/ethnic breakdown for all students.
| Race/Ethnicity | Number |
|---|---|
| White | 3,702 |
| Black or African American | 818 |
| Hispanic | 486 |
| Unknown | 340 |
| Asian | 248 |
| Multi-Ethnic | 241 |
| International | 98 |
| Native Hawaiian or Pacific Islander | 15 |

There are approximately 3,331 female students and 2,633 male students at Campbell.
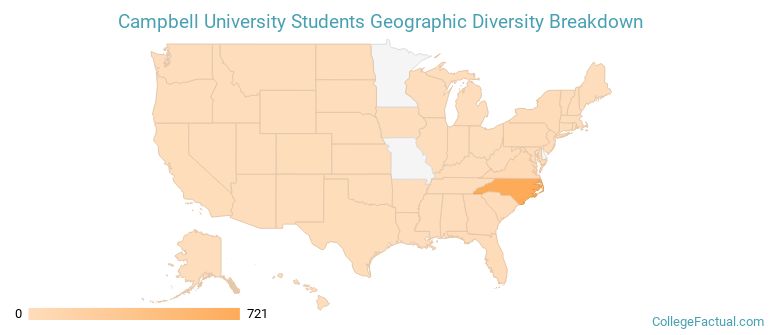
Campbell ranks 863 out of 2,183 when it comes to geographic diversity.
19.89% of Campbell students come from out of state, and 1.32% come from out of the country.
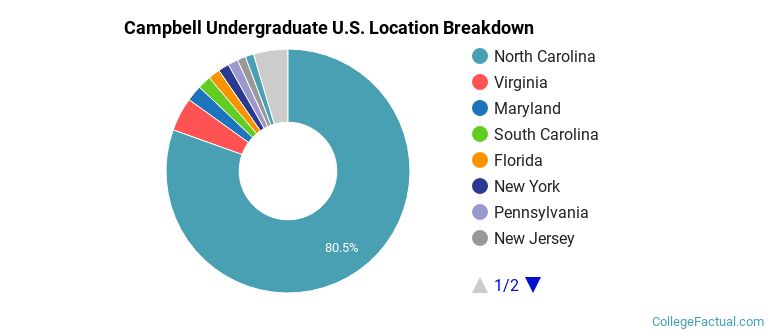
The undergraduate student body is split among 27 states (may include Washington D.C.). Click on the map for more detail.
| State | Amount |
|---|---|
| North Carolina | 721 |
| Virginia | 40 |
| Maryland | 19 |
| South Carolina | 16 |
| Florida | 14 |
Students from 46 countries are represented at this school, with the majority of the international students coming from India, Sweden, and Spain.
Learn more about international students at Campbell.
A traditional college student is defined as being between the ages of 18-21. At Campbell, 41.04% of students fall into that category, compared to the national average of 60%.
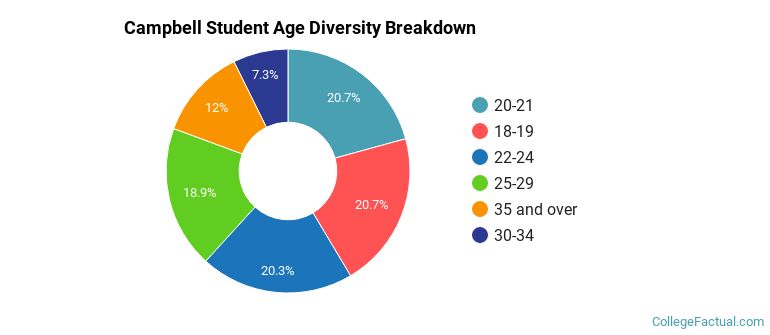
| Student Age Group | Amount |
|---|---|
| 20-21 | 1,357 |
| 18-19 | 1,353 |
| 22-24 | 1,330 |
| 25-29 | 1,235 |
| 35 and over | 788 |
| 30-34 | 478 |
| Under 18 | 0 |
Footnotes
*The racial-ethnic minorities count is calculated by taking the total number of students and subtracting white students, international students, and students whose race/ethnicity was unknown. This number is then divided by the total number of students at the school to obtain the racial-ethnic minorities percentage.
References
Department of Homeland Security Citizenship and Immigration Services
Image Credit: By Ildar Sagdejev under License