Explore the best ranked schools for the programs you are most interested in.
Canadian Valley Technology Center was not ranked in College Factual's 2025 Best Overall Colleges report. This could be for a number of reasons, including lack of data.
See all of the rankings for Canadian Valley Technology Center.
Returning adults and other non-traditional students may appreciate the fact that Canadian Valley Technology Center has an open admissions policy. This means that you'll only have to submit basic materials, which may include proof that you completed high school or an equivalent program.
At Canadian Valley Technology Center, the student to faculty ratio is an excellent 11 to 1. That's much better than the national average of 15 to 1. This indicates that many classes will probably be small, and students will have ample opportunites to work closely with their professors and classmates.
The freshmen retention rate is a sign of how many full-time students like a college or university well enough to come back for their sophomore year. At Canadian Valley Technology Center this rate is 55%, which is a bit lower than the national average of 68%.
During the 2017-2018 academic year, there were 1,555 undergraduates at Canadian Valley Technology Center with 234 being full-time and 1,321 being part-time.
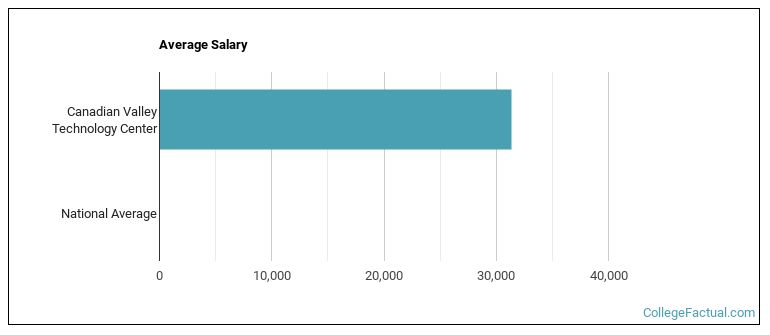
The net price is calculated by adding tuition, room, board and other costs and subtracting financial aid.Note that the net price is typically less than the published for a school. For more information on the sticker price of Canadian Valley Technology Center, see our tuition and fees and room and board pages.
See which majors at Canadian Valley Technology Center make the most money.
Get more details about the location of Canadian Valley Technology Center.

Contact details for Canadian Valley Technology Center are given below.
| Contact Details | |
|---|---|
| Address: | 6505 E Hwy 66, El Reno, OK 73036-9117 |
| Phone: | 405-262-2629 |
| Website: | www.cvtech.edu/ |
| Most Popular Majors | Bachelor’s Degrees | Average Salary of Graduates |
|---|---|---|
| Practical Nursing & Nursing Assistants | 137 | NA |
| Vehicle Maintenance & Repair | 75 | NA |
| Cosmetology | 48 | NA |
| Precision Metal Working | 44 | NA |
| Heating, Air Conditioning, Ventilation & Refrigeration | 31 | NA |
| Computer Systems Networking | 28 | NA |
| Design & Applied Arts | 23 | NA |
| Computer Systems Analysis | 21 | NA |
| Drafting & Design Engineering Technology | 20 | NA |
| Business Administration & Management | 16 | NA |
Footnotes
*The racial-ethnic minorities count is calculated by taking the total number of students and subtracting white students, international students, and students whose race/ethnicity was unknown. This number is then divided by the total number of students at the school to obtain the racial-ethnic minorities percentage.
References
More about our data sources and methodologies.