Here, you'll find out more about the major, including such details as the number of graduates, what degree levels are offered, ethnicity of students, average salaries, and more. Also, learn how Capella University ranks among other schools offering degrees in business administration.
Go directly to any of the following sections:
The business administration major at Capella University is not ranked on College Factual’s Best Colleges and Universities for Business Administration & Management. This could be for a number of reasons, such as not having enough data on the major or school to make an accurate assessment of its quality.
During the 2021-2022 academic year, Capella University handed out 626 bachelor's degrees in business administration & management. This is a decrease of 13% over the previous year when 721 degrees were handed out.
In 2022, 746 students received their master’s degree in business administration from Capella University. This makes it the #20 most popular school for business administration master’s degree candidates in the country.
In addition, 127 students received their doctoral degrees in business administration in 2022, making the school the #4 most popular school in the United States for this category of students.
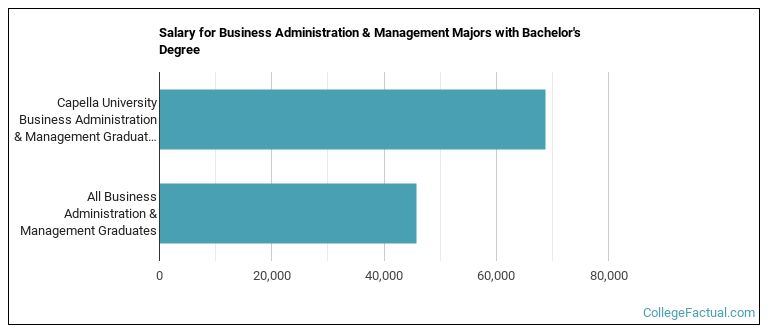
Business Administration majors who earn their bachelor's degree from Capella University go on to jobs where they make a median salary of $68,701 a year. This is great news for graduates of the program, since this figure is higher than the national average of $45,741 for all business administration bachelor's degree recipients.
During the 2022-2023 academic year, part-time undergraduate students at Capella University paid an average of $401 per credit hour. No discount was available for in-state students. The average full-time tuition and fees for undergraduates are shown in the table below.
| In State | Out of State | |
|---|---|---|
| Tuition | $14,436 | $14,436 |
| Books and Supplies | $422 | $422 |
Learn more about Capella University tuition and fees.
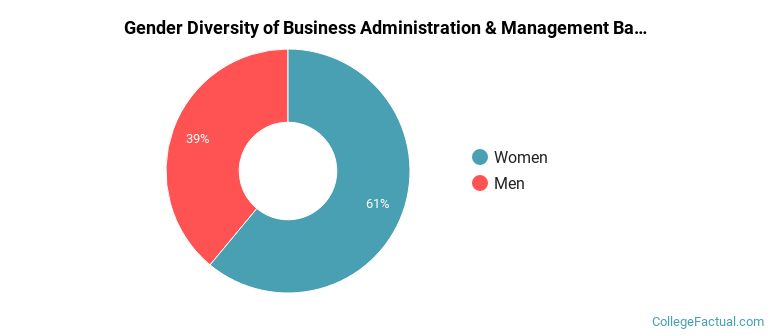
In the 2021-2022 academic year, 626 students earned a bachelor's degree in business administration from Capella University. About 61% of these graduates were women and the other 39% were men.
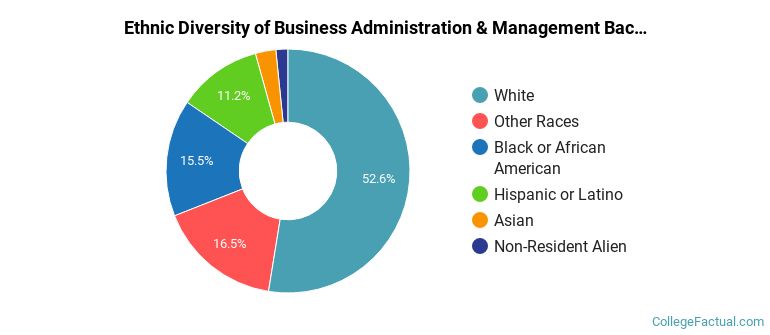
The majority of bachelor's degree recipients in this major at Capella University are white. In the most recent graduating class for which data is available, 53% of students fell into this category.
The following table and chart show the ethnic background for students who recently graduated from Capella University with a bachelor's in business administration.
| Ethnic Background | Number of Students |
|---|---|
| Asian | 17 |
| Black or African American | 97 |
| Hispanic or Latino | 70 |
| White | 329 |
| Non-Resident Aliens | 10 |
| Other Races | 103 |
Capella University does not offer an online option for its business administration bachelor’s degree program at this time. To see if the school offers distance learning options in other areas, visit the Capella University Online Learning page.
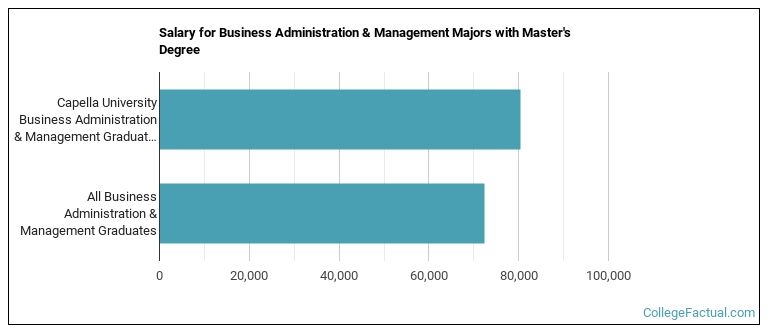
Business Administration majors graduating with a master's degree from Capella University make a median salary of $80,504 a year. This is a better than average outcome since the median salary for all business administration graduates with a master's is $72,329.
In the 2021-2022 academic year, 612 students earned a master's degree in business administration from Capella University. About 66% of these graduates were women and the other 34% were men.
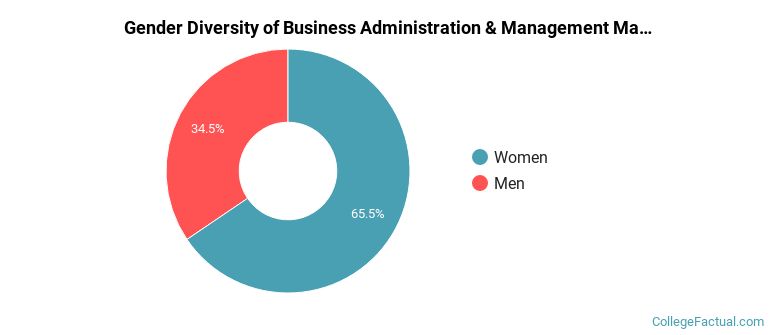
The majority of the students with this major are white. About 53% of 2022 graduates were in this category.
The following table and chart show the ethnic background for students who recently graduated from Capella University with a master's in business administration.
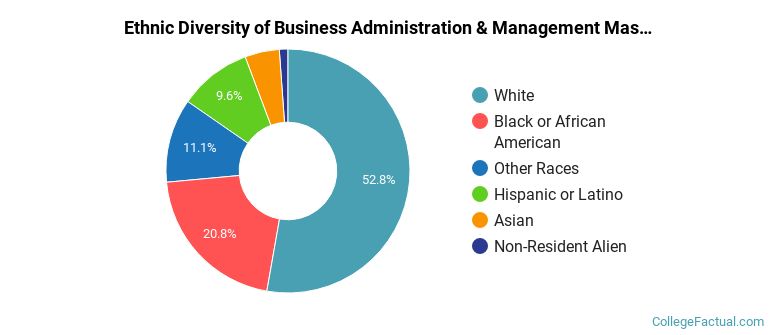
| Ethnic Background | Number of Students |
|---|---|
| Asian | 28 |
| Black or African American | 127 |
| Hispanic or Latino | 59 |
| White | 323 |
| Non-Resident Aliens | 7 |
| Other Races | 68 |
Take a look at the following statistics related to the make-up of the business administration majors at Capella University.
| Related Major | Annual Graduates |
|---|---|
| Human Resource Management | 486 |
| Accounting | 112 |
| Management Sciences & Quantitative Methods | 54 |
| Finance & Financial Management | 18 |
| Marketing | 7 |
View All Business Administration & Management Related Majors >