Explore the best ranked schools for the programs you are most interested in.
According to College Factual's 2025 analysis, Capital is ranked #1,336 out of 2,152 schools in the nation that were analyzed for overall quality.
Capital is also ranked #50 out of 91 schools in Ohio.
When it comes to admittance, Capital University is somewhat selective. Its acceptance rate is 72%, which means you'll face some strong competition during the admissions process. Do what you can to make your application stand out.
About 16% of students accepted to Capital submitted their SAT scores. When looking at the 25th through the 75th percentile, SAT Evidence-Based Reading and Writing scores ranged between 470 and 593. Math scores were between 490 and 593.
The student to faculty ratio is often used to measure the number of teaching resources that a college or university offers its students. The national average for this metric is 15 to 1, but at Capital it is much better at 9 to 1. That's good news for students who want to interact more on a personal level with their teachers.
When estimating how much access students will have to their teachers, some people like to look at what percentage of faculty members are full time. This is because part-time teachers may not have as much time to spend on campus as their full-time counterparts.
The full-time faculty percentage at Capital University is 31%. This is lower than the national average of 47%.
The freshmen retention rate of 78% tells us that most first-year, full-time students like Capital University enough to come back for another year. This is a fair bit higher than the national average of 68%. That's certainly something to check off in the good column about the school.
Students are considered to have graduated on time if they finish their studies within four years. At Capital the on-time graduation rate of first-time, full-time students is 53%. That is great when compared to the national average of 33.3%
Find out more about the retention and graduation rates at Capital University.
During the 2017-2018 academic year, there were 2,282 undergraduates at Capital with 2,152 being full-time and 130 being part-time.
| $0-30 K | $30K-48K | $48-75 | $75-110K | $110K + |
|---|---|---|---|---|
| $21,705 | $20,210 | $22,174 | $24,781 | $26,836 |
The net price is calculated by adding tuition, room, board and other costs and subtracting financial aid.Note that the net price is typically less than the published for a school. For more information on the sticker price of Capital, see our tuition and fees and room and board pages.
While almost two-thirds of students nationwide take out loans to pay for college, the percentage may be quite different for the school you plan on attending. At Capital, approximately 83% of students took out student loans averaging $7,260 a year. That adds up to $29,040 over four years for those students.
Get more details about the location of Capital University.
Contact details for Capital are given below.
| Contact Details | |
|---|---|
| Address: | 1 College And Main, Columbus, OH 43209-2394 |
| Phone: | 614-236-6011 |
| Website: | https://www.capital.edu/ |
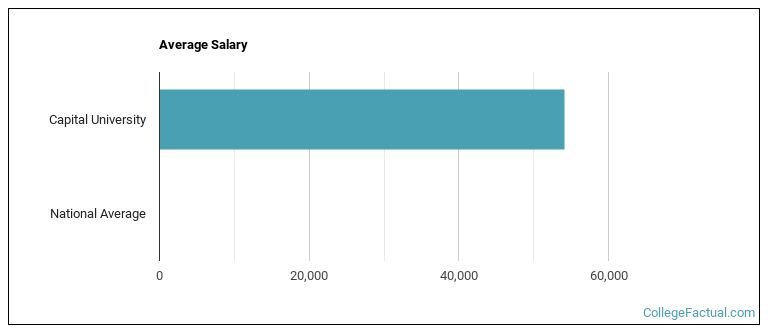
| Most Popular Majors | Bachelor’s Degrees | Average Salary of Graduates |
|---|---|---|
| Law | 136 | NA |
| Nursing | 89 | $70,365 |
| Business Administration & Management | 68 | $47,811 |
| General Psychology | 36 | $34,041 |
| Teacher Education Subject Specific | 35 | $32,597 |
| Teacher Education Grade Specific | 32 | $42,094 |
| Social Work | 28 | $44,344 |
| Music | 28 | $33,143 |
| General Biology | 25 | $36,709 |
| Radio, Television & Digital Communication | 25 | $28,045 |
Online courses area a great option for busy, working students as well as for those who have scheduling conflicts and want to study on their own time. As time goes by, expect to see more and more online learning options become available.
In 2022-2023, 1,097 students took at least one online class at Capital University. This is a decrease from the 1,346 students who took online classes the previous year.
| Year | Took at Least One Online Class | Took All Classes Online |
|---|---|---|
| 2022-2023 | 1,097 | 80 |
| 2021-2022 | 1,346 | 99 |
| 2020-2021 | 681 | 307 |
| 2018-2019 | 477 | 13 |
If you’re considering Capital University, here are some more schools you may be interested in knowing more about.
Curious on how these schools stack up against Capital? Pit them head to head with College Combat, our free interactive tool that lets you compare college on the features that matter most to you!
Footnotes
*The racial-ethnic minorities count is calculated by taking the total number of students and subtracting white students, international students, and students whose race/ethnicity was unknown. This number is then divided by the total number of students at the school to obtain the racial-ethnic minorities percentage.
References
More about our data sources and methodologies.