Below are the key facts about this program at The Catholic University of America. You can study it at the Bachelor’s level, with graduate study also available. Jump to any of the following sections:
Here is each degree level available for fine & studio arts at The Catholic University of America, along with how many graduates complete each level annually.
| Degree Level | Annual Graduates |
|---|---|
| Bachelor’s | 10 |
| Graduate Certificate | 1 |
In the most recent year for which we have data, The Catholic University of America awarded 10 bachelor’s degrees in fine & studio arts.
The Catholic University of America is not currently ranked for fine & studio arts at the bachelor’s level.
Average full-time tuition and fees are listed in the table below.
| In State | Out of State | |
|---|---|---|
| Tuition | $51,040 | $56,930 |
| Fees | $1,448 | $1,448 |
Read more about The Catholic University of America tuition and fees.
For the most recent academic year available, 30% of fine & studio arts bachelor’s degrees went to men and 70% went to women.
 The largest share of fine & studio arts bachelor’s degree graduates at The Catholic University of America are White. Roughly 40% of graduates fell into this category.
The following table and chart show the ethnic background for students who recently graduated from The Catholic University of America with a bachelor’s in fine & studio arts.
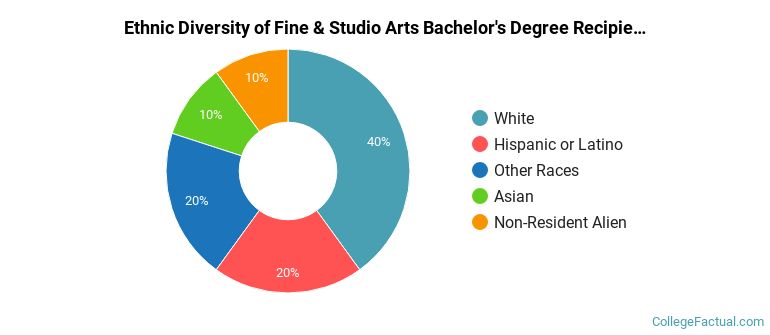
| Ethnic Background | Number of Students |
|---|---|
| Asian | 1 |
| Black or African American | 0 |
| Hispanic or Latino | 2 |
| White | 4 |
| Non-Resident Aliens | 1 |
| Other Races | 2 |
The Catholic University of America conferred 7 bachelor’s completions in fine/studio arts, general in the most recent reporting year — 71% to women and 29% to men. Most of these graduates identified as Hispanic or Latino (29%).
The Catholic University of America conferred 3 bachelor’s degrees in art history, criticism and conservation in the most recent reporting year — 67% to women and 33% to men. Most of these graduates identified as White (100%).
This program is also offered at the graduate level at The Catholic University of America. Here are the graduate award levels offered.
| Graduate Level | Annual Graduates |
|---|---|
| Graduate Certificate Degrees in Fine & Studio Arts | 1 |