CUA total enrollment is approximately 5,366 students. 2,934 are undergraduates and 996 are graduate students.
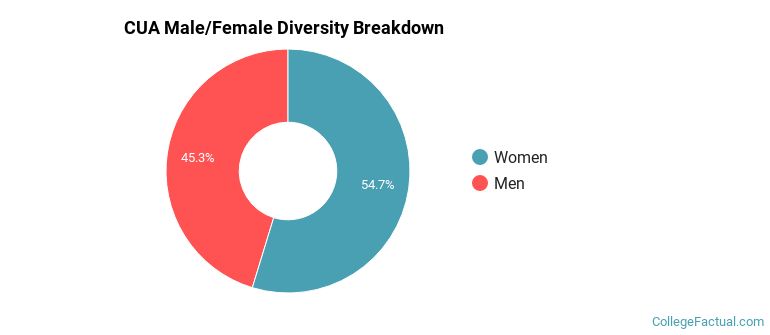
Male/Female Breakdown of Undergraduates
The full-time CUA undergraduate population is made up of 57% women, and 43% men.
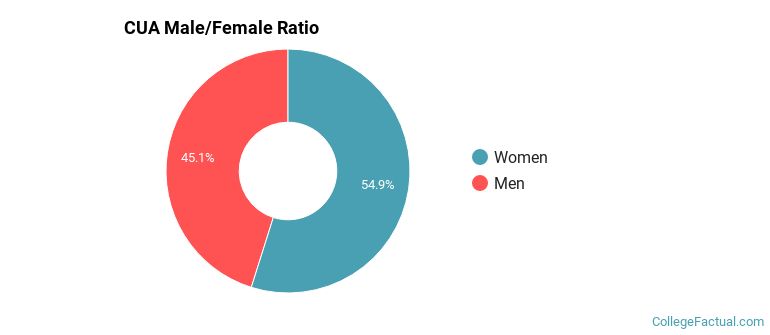
For the gender breakdown for all students, go here.
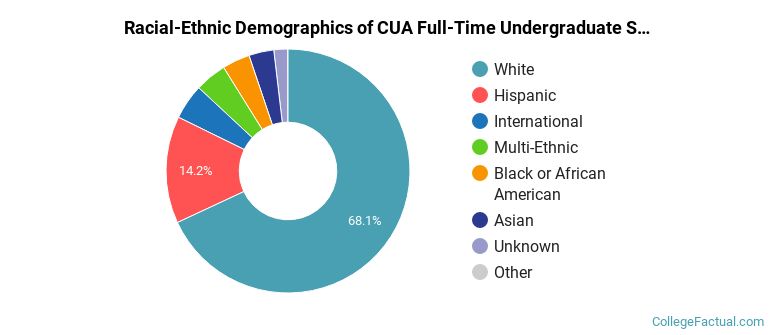
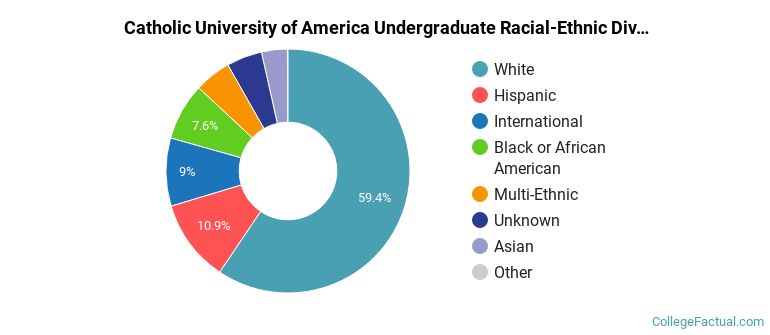
CUA Racial/Ethnic Breakdown of Undergraduates
| Race/Ethnicity | Number |
|---|---|
| White | 2,025 |
| Hispanic | 424 |
| Multi-Ethnic | 119 |
| Black or African American | 103 |
| International | 101 |
| Asian | 86 |
| Unknown | 70 |
| Native Hawaiian or Pacific Islander | 1 |
See racial/ethnic breakdown for all students.
Male/Female Breakdown of Graduate Students
About 50% of full-time grad students are women, and 50% men.
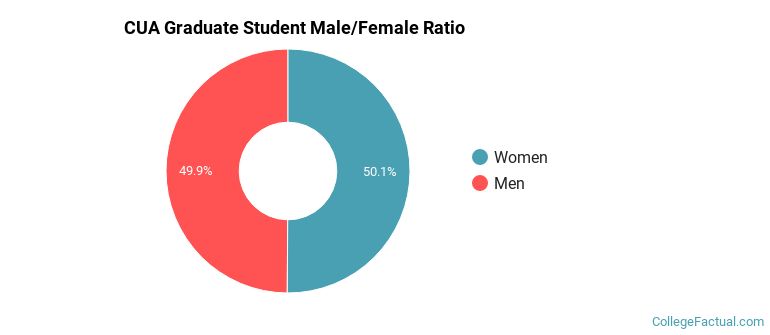
For the gender breakdown for all students, go here.
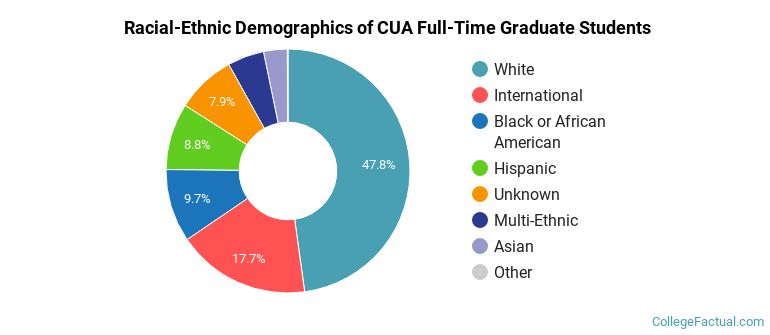
CUA Racial-Ethnic Breakdown of Graduate Students
| Race/Ethnicity | Number |
|---|---|
| White | 534 |
| International | 154 |
| Hispanic | 91 |
| Black or African American | 82 |
| Unknown | 62 |
| Multi-Ethnic | 43 |
| Asian | 28 |
| Native Hawaiian or Pacific Islander | 1 |
See racial/ethnic breakdown for all students.
| Race/Ethnicity | Number |
|---|---|
| White | 3,254 |
| Hispanic | 629 |
| International | 459 |
| Black or African American | 370 |
| Multi-Ethnic | 246 |
| Unknown | 227 |
| Asian | 171 |
| Native Hawaiian or Pacific Islander | 3 |
There are approximately 2,962 female students and 2,404 male students at CUA.
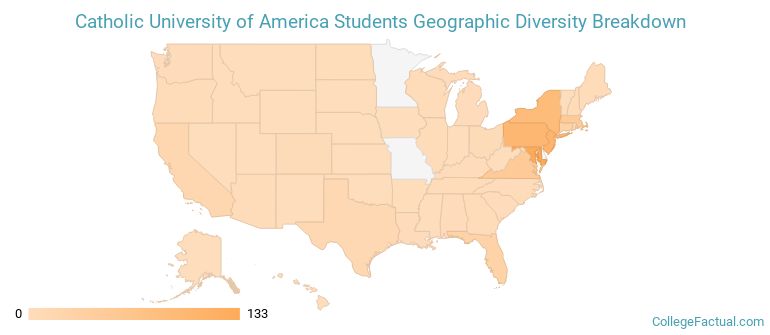
CUA ranks 136 out of 2,183 when it comes to geographic diversity.
97.09% of CUA students come from out of state, and 0% come from out of the country.
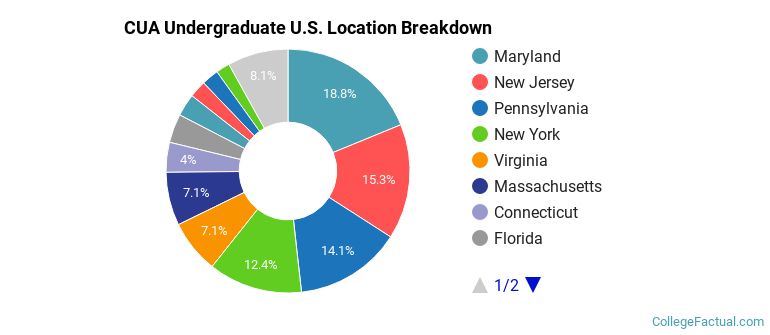
The undergraduate student body is split among 32 states (may include Washington D.C.). Click on the map for more detail.
| State | Amount |
|---|---|
| Maryland | 133 |
| New Jersey | 108 |
| Pennsylvania | 100 |
| New York | 88 |
| Massachusetts | 50 |
Students from 75 countries are represented at this school, with the majority of the international students coming from Saudi Arabia, Vietnam, and China.
Learn more about international students at CUA.
A traditional college student is defined as being between the ages of 18-21. At CUA, 47.14% of students fall into that category, compared to the national average of 60%.
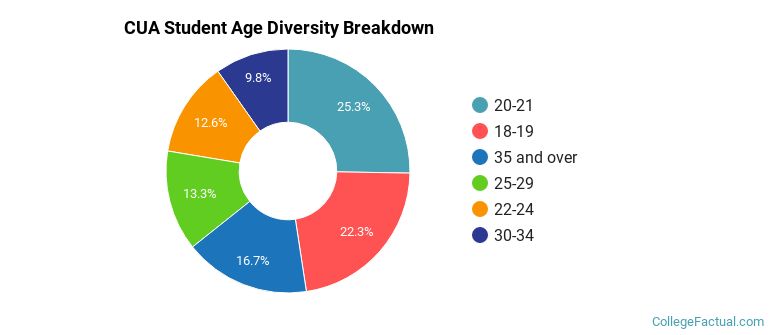
| Student Age Group | Amount |
|---|---|
| 20-21 | 1,508 |
| 18-19 | 1,331 |
| 35 and over | 997 |
| 25-29 | 795 |
| 22-24 | 753 |
| 30-34 | 582 |
| Under 18 | 0 |
Footnotes
*The racial-ethnic minorities count is calculated by taking the total number of students and subtracting white students, international students, and students whose race/ethnicity was unknown. This number is then divided by the total number of students at the school to obtain the racial-ethnic minorities percentage.
References
Department of Homeland Security Citizenship and Immigration Services
Image Credit: By Gryffindor under License
Read College Factual's Diversity Ranking Methodology.