We’ve pulled together the essential facts you should know about the program at Cedarville University. Degrees are awarded at the Bachelor’s level. At its best it places at #6 out of 15 schools (Bachelor’s level) by College Factual. Jump to any of the following sections:
College Factual rates Cedarville University among the top schools in the country for design & applied arts, placing at #182 out of 558 schools nationally.
| Ranking | Rank |
|---|---|
| Best Design & Applied Arts Schools | 182 of 558 |
| Best Design & Applied Arts Schools in Ohio | 6 of 21 |
| Best Design & Applied Arts Schools in the Great Lakes Region | 30 of 77 |
The table below lists every degree level offered in design & applied arts at Cedarville University, along with how many graduates complete each level annually.
| Degree Level | Annual Graduates |
|---|---|
| Bachelor’s | 34 |
During the most recent reporting year, Cedarville University conferred 34 bachelor’s degrees in design & applied arts.
Cedarville University is a solid choice among schools offering design & applied arts at the bachelor’s level. Its best result was #6 out of 15 schools by College Factual.
Design & Applied Arts graduates with a bachelor’s degree from Cedarville University earn a median of $48,514 a year. This is below $61,536, the median for all majors at Cedarville University.
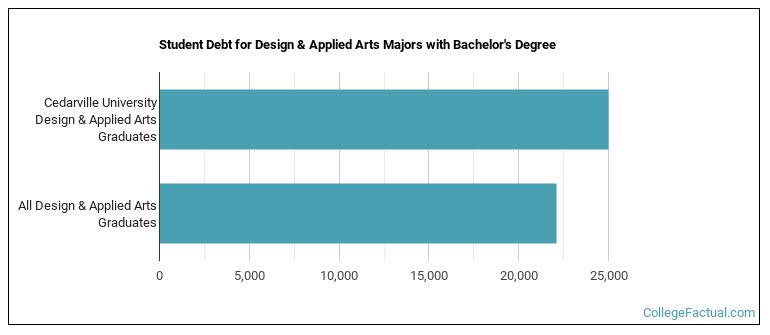
To complete a bachelor’s at Cedarville University, design & applied arts students accumulate a median of $25,000 in student loans. This is higher than $22,110, the typical median for all majors at Cedarville University.
Average full-time tuition and fees are listed in the table below.
| In State | Out of State | |
|---|---|---|
| Tuition | $33,174 | $36,950 |
| Fees | $200 | $200 |
Read more about Cedarville University tuition and fees.
Among recent graduates, 50% of design & applied arts bachelor’s degrees went to men and 50% went to women.
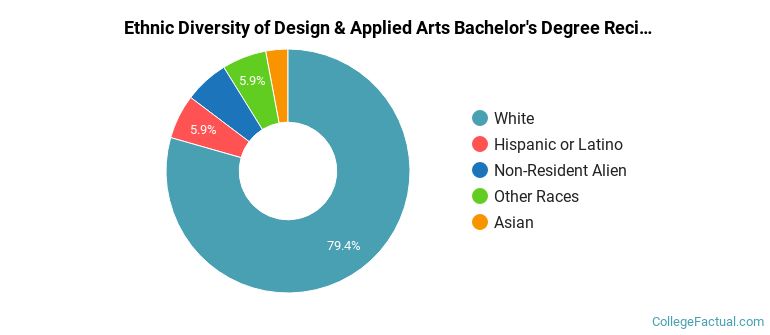
 The majority of design & applied arts bachelor’s degree graduates at Cedarville University are White. Roughly 79% of graduates fell into this category.
The following table and chart show the ethnic background for students who recently graduated from Cedarville University with a bachelor’s in design & applied arts.
| Ethnic Background | Number of Students |
|---|---|
| Asian | 1 |
| Black or African American | 0 |
| Hispanic or Latino | 2 |
| White | 27 |
| Non-Resident Aliens | 2 |
| Other Races | 2 |
Cedarville University granted 18 bachelor’s completions in graphic design in the latest year of data — 67% to women and 33% to men. The largest share of these graduates were White (67%).
Cedarville University granted 16 bachelor’s degrees in industrial and product design in the most recent reporting year — 31% to women and 69% to men. Most of these graduates identified as White (94%).
