Here, you'll find out more about the major, including such details as the number of graduates, what degree levels are offered, ethnicity of students, average salaries, and more. We've also included details on how Chapman ranks compared to other colleges offering a major in public health.
Jump to any of the following sections:
The bachelor's program at Chapman was ranked #129 on College Factual's Best Schools for public health list. It is also ranked #21 in California.
| Ranking Type | Rank |
|---|---|
| Best Public Health Bachelor’s Degree Schools | 94 |
| Best Public Health Schools | 129 |
During the 2021-2022 academic year, Chapman University handed out 116 bachelor's degrees in public health. This is an increase of 12% over the previous year when 104 degrees were handed out.
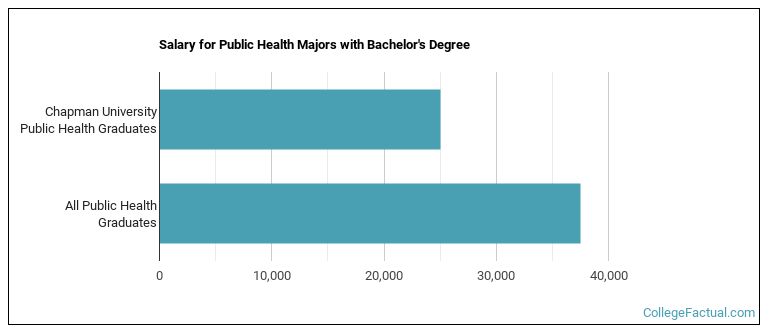
The median salary of public health students who receive their bachelor's degree at Chapman is $25,007. Unfortunately, this is lower than the national average of $37,533 for all public health students.
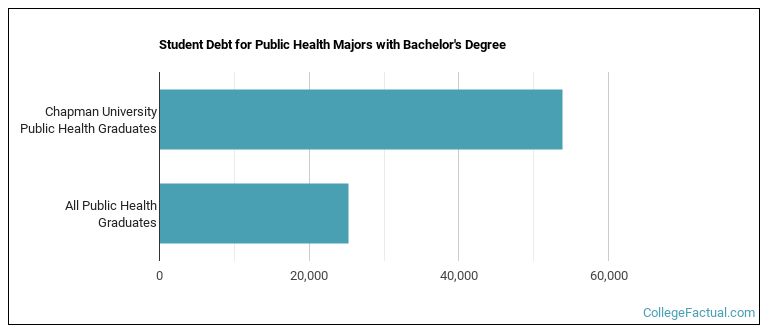
While getting their bachelor's degree at Chapman, public health students borrow a median amount of $53,815 in student loans. This is higher than the the typical median of $25,250 for all public health majors across the country.
The typical student loan payment of a bachelor's degree student from the public health program at Chapman is $510 per month.
During the 2022-2023 academic year, part-time undergraduate students at Chapman paid an average of $1,940 per credit hour. No discount was available for in-state students. Information about average full-time undergraduate tuition and fees is shown in the table below.
| In State | Out of State | |
|---|---|---|
| Tuition | $62,400 | $62,400 |
| Fees | $384 | $384 |
| Books and Supplies | $1,600 | $1,600 |
| On Campus Room and Board | $17,378 | $17,378 |
| On Campus Other Expenses | $3,318 | $3,318 |
Learn more about Chapman tuition and fees.
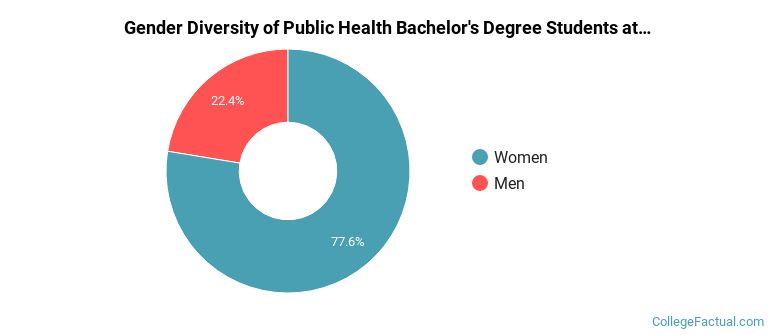
During the 2021-2022 academic year, 116 students graduated with a bachelor's degree in public health from Chapman. About 22% were men and 78% were women.
The following table and chart show the ethnic background for students who recently graduated from Chapman University with a bachelor's in public health.
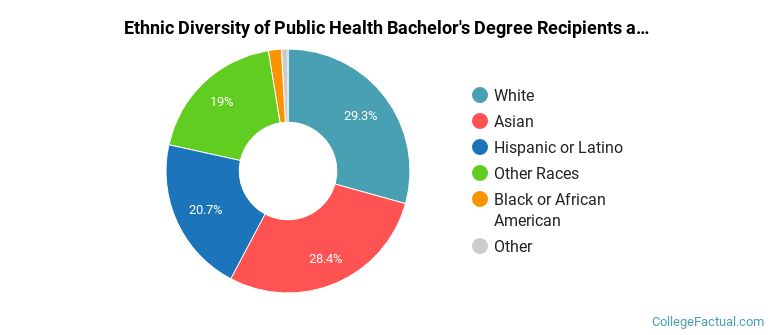
| Ethnic Background | Number of Students |
|---|---|
| Asian | 33 |
| Black or African American | 2 |
| Hispanic or Latino | 24 |
| White | 34 |
| Non-Resident Aliens | 1 |
| Other Races | 22 |
Chapman does not offer an online option for its public health bachelor’s degree program at this time. To see if the school offers distance learning options in other areas, visit the Chapman Online Learning page.
Take a look at the following statistics related to the make-up of the public health majors at Chapman University.
| Related Major | Annual Graduates |
|---|---|
| Pharmacy/Pharmaceutical Sciences | 101 |
| Rehabilitation & Therapeutic Professions | 83 |
| Allied Health Professions | 46 |
| Communication Sciences | 42 |
| Mental & Social Health Services | 30 |
More about our data sources and methodologies.