Chapman total enrollment is approximately 9,761 students. 6,843 are undergraduates and 1,816 are graduate students.
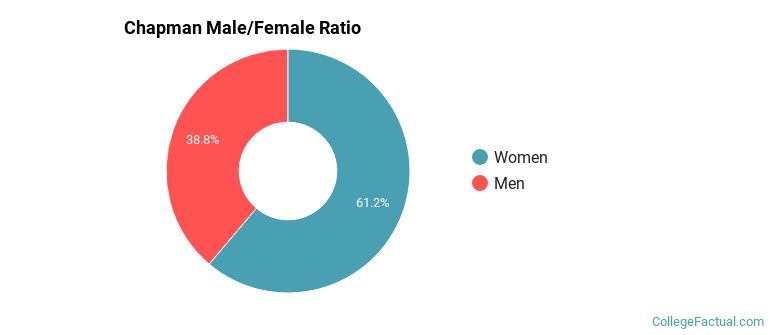
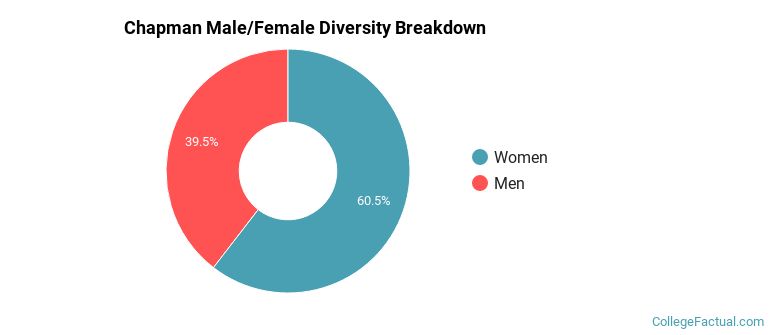
Male/Female Breakdown of Undergraduates
The full-time Chapman undergraduate population is made up of 61% women, and 39% men.
For the gender breakdown for all students, go here.
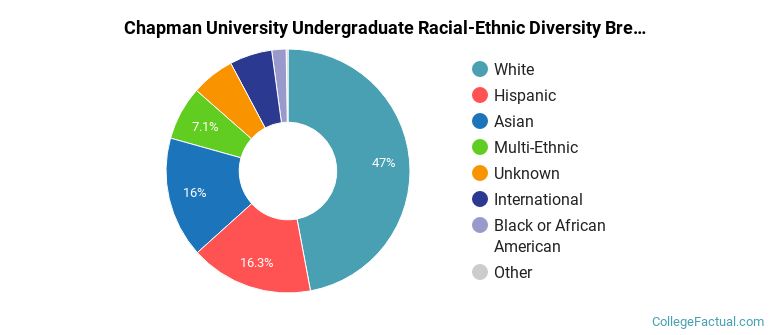
Chapman Racial/Ethnic Breakdown of Undergraduates
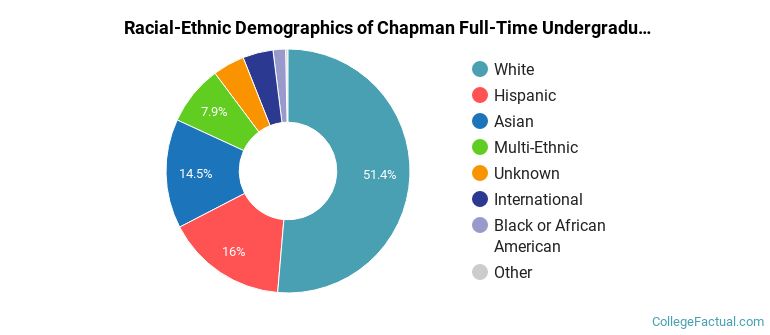
| Race/Ethnicity | Number |
|---|---|
| White | 3,506 |
| Hispanic | 1,176 |
| Asian | 1,023 |
| Multi-Ethnic | 553 |
| Unknown | 223 |
| International | 213 |
| Black or African American | 118 |
| Native Hawaiian or Pacific Islander | 23 |
See racial/ethnic breakdown for all students.
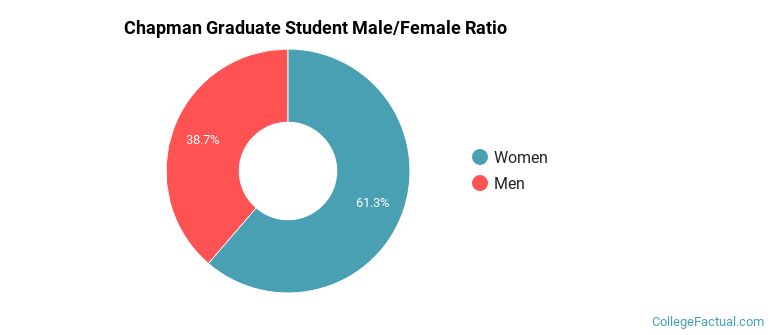
Male/Female Breakdown of Graduate Students
About 61% of full-time grad students are women, and 39% men.
For the gender breakdown for all students, go here.
Chapman Racial-Ethnic Breakdown of Graduate Students
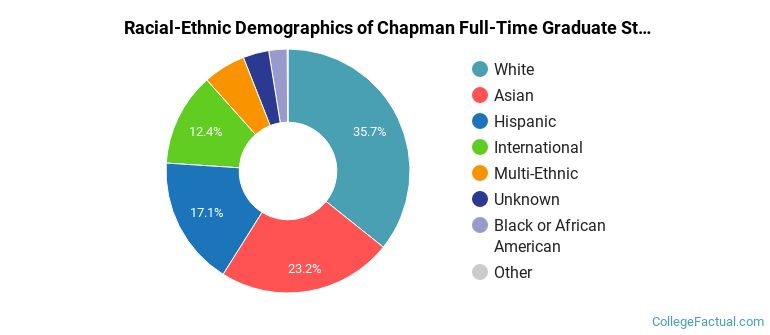
| Race/Ethnicity | Number |
|---|---|
| White | 664 |
| Asian | 449 |
| Hispanic | 325 |
| International | 172 |
| Multi-Ethnic | 104 |
| Black or African American | 49 |
| Unknown | 49 |
| Native Hawaiian or Pacific Islander | 3 |
See racial/ethnic breakdown for all students.
| Race/Ethnicity | Number |
|---|---|
| White | 4,592 |
| Hispanic | 1,702 |
| Asian | 1,594 |
| Multi-Ethnic | 720 |
| Unknown | 470 |
| International | 447 |
| Black or African American | 199 |
| Native Hawaiian or Pacific Islander | 27 |
There are approximately 5,900 female students and 3,861 male students at Chapman.
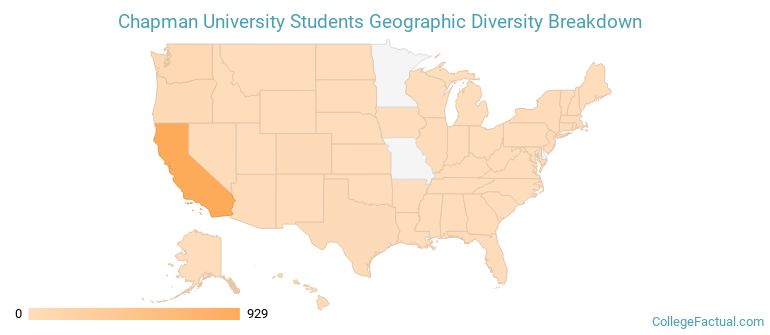
Chapman ranks 266 out of 2,183 when it comes to geographic diversity.
35.37% of Chapman students come from out of state, and 5.01% come from out of the country.
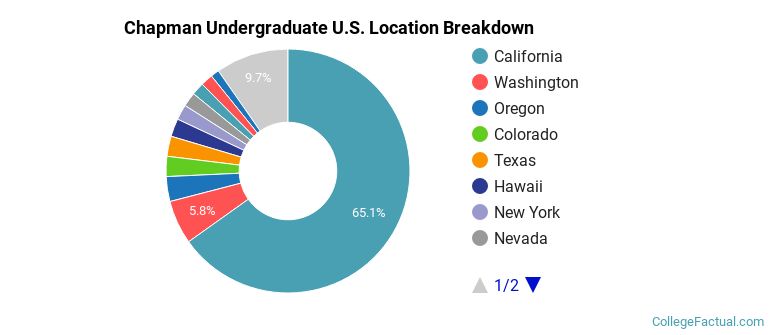
The undergraduate student body is split among 42 states (may include Washington D.C.). Click on the map for more detail.
| State | Amount |
|---|---|
| California | 929 |
| Washington | 83 |
| Oregon | 47 |
| Colorado | 38 |
| Texas | 38 |
Students from 75 countries are represented at this school, with the majority of the international students coming from China, Saudi Arabia, and India.
Learn more about international students at Chapman.
A traditional college student is defined as being between the ages of 18-21. At Chapman, 63.46% of students fall into that category, compared to the national average of 60%.
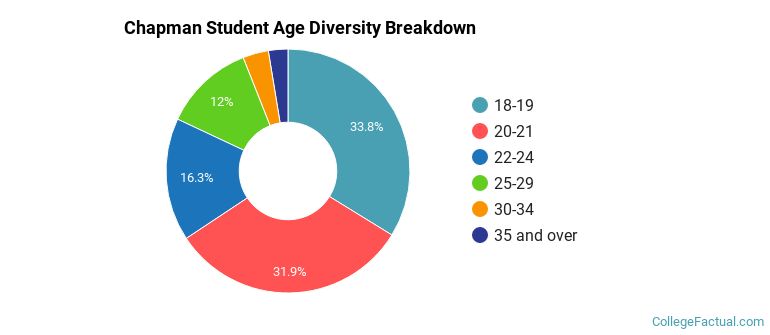
| Student Age Group | Amount |
|---|---|
| 18-19 | 3,066 |
| 20-21 | 2,894 |
| 22-24 | 1,479 |
| 25-29 | 1,091 |
| 30-34 | 309 |
| 35 and over | 235 |
| Under 18 | 0 |
Footnotes
*The racial-ethnic minorities count is calculated by taking the total number of students and subtracting white students, international students, and students whose race/ethnicity was unknown. This number is then divided by the total number of students at the school to obtain the racial-ethnic minorities percentage.
References
Department of Homeland Security Citizenship and Immigration Services
Image Credit: By Tom Arthur under License
Find out how College Factual created their Diversity Rankings.