CDU total enrollment is approximately 872 students. 168 are undergraduates and 582 are graduate students.
Male/Female Breakdown of Undergraduates
The full-time CDU undergraduate population is made up of 63% women, and 37% men.
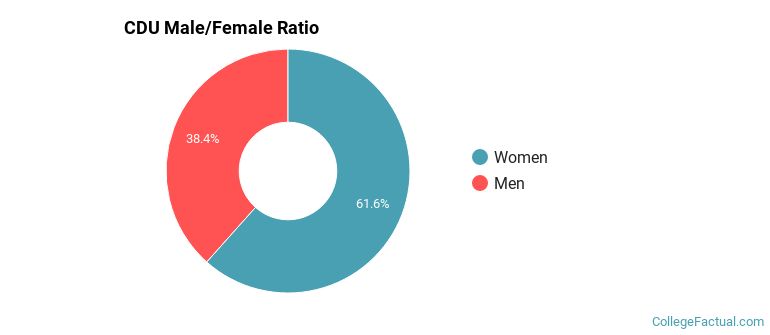
For the gender breakdown for all students, go here.
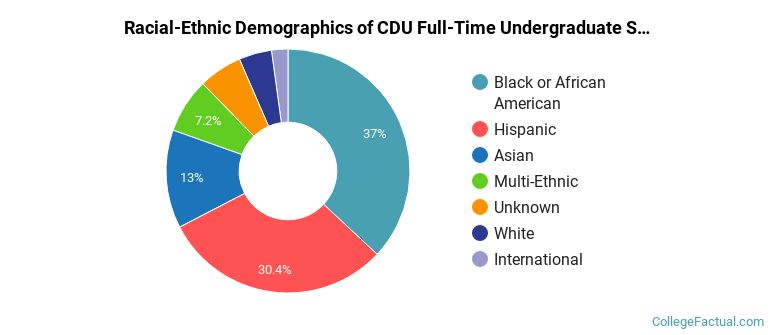
CDU Racial/Ethnic Breakdown of Undergraduates
| Race/Ethnicity | Number |
|---|---|
| Black or African American | 59 |
| Hispanic | 47 |
| Unknown | 28 |
| Asian | 20 |
| Multi-Ethnic | 7 |
| White | 5 |
| International | 2 |
| Native Hawaiian or Pacific Islander | 0 |
See racial/ethnic breakdown for all students.
Male/Female Breakdown of Graduate Students
About 77% of full-time grad students are women, and 23% men.

For the gender breakdown for all students, go here.
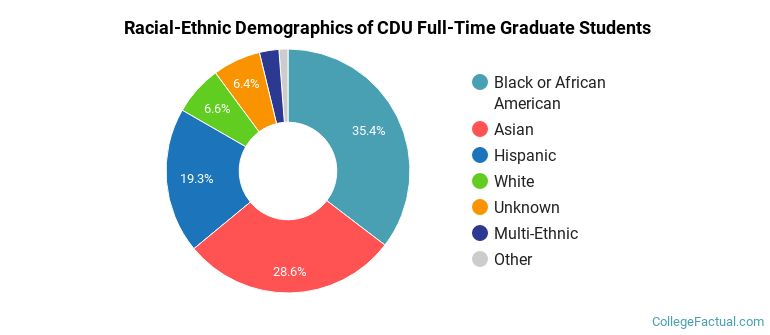
CDU Racial-Ethnic Breakdown of Graduate Students
| Race/Ethnicity | Number |
|---|---|
| Black or African American | 187 |
| Asian | 149 |
| Hispanic | 116 |
| White | 59 |
| Unknown | 35 |
| Multi-Ethnic | 22 |
| Native Hawaiian or Pacific Islander | 9 |
| International | 5 |
See racial/ethnic breakdown for all students.
| Race/Ethnicity | Number |
|---|---|
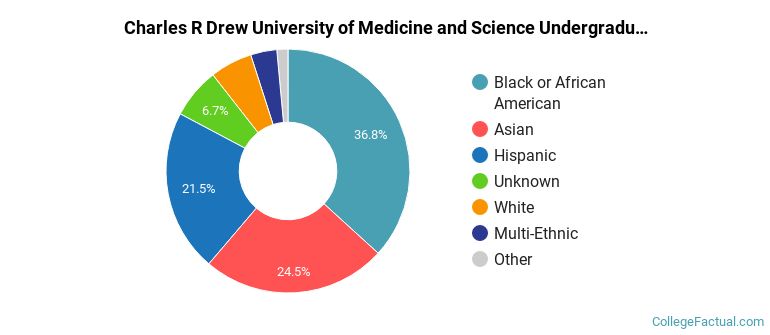
| Black or African American | 292 |
| Hispanic | 193 |
| Asian | 191 |
| Unknown | 72 |
| White | 70 |
| Multi-Ethnic | 36 |
| Native Hawaiian or Pacific Islander | 10 |
| International | 8 |
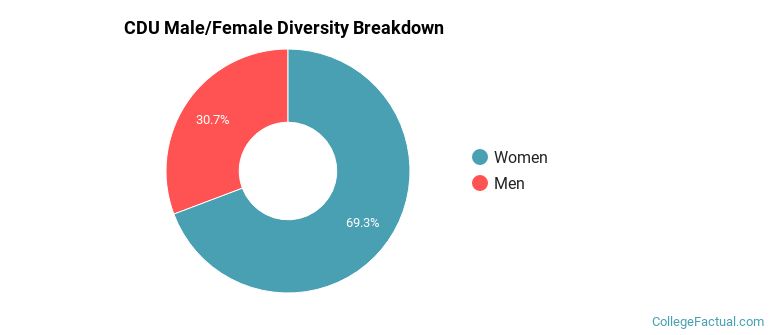
There are approximately 646 female students and 226 male students at CDU.
Learn more about international students at CDU.
A traditional college student is defined as being between the ages of 18-21. At CDU, 4.42% of students fall into that category, compared to the national average of 60%.
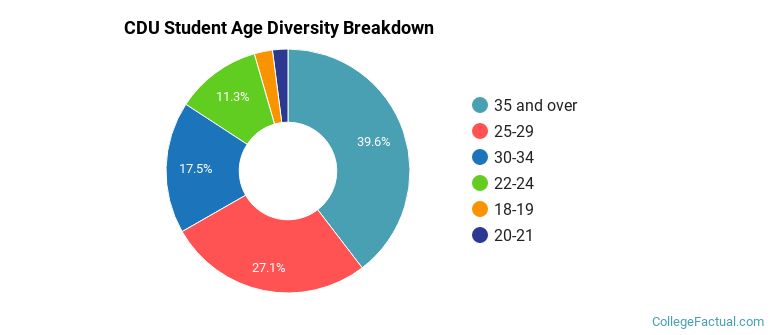
| Student Age Group | Amount |
|---|---|
| 35 and over | 213 |
| 25-29 | 146 |
| 30-34 | 94 |
| 22-24 | 61 |
| 18-19 | 13 |
| 20-21 | 11 |
| Under 18 | 0 |
Footnotes
*The racial-ethnic minorities count is calculated by taking the total number of students and subtracting white students, international students, and students whose race/ethnicity was unknown. This number is then divided by the total number of students at the school to obtain the racial-ethnic minorities percentage.
References