Explore the best ranked schools for the programs you are most interested in.
CTC was not ranked in College Factual's Best Overall Colleges report this year. This may be because not enough data was available.
Since Charlotte Technical College has an open admissions policy, being accepted to the school isn't that hard. However, a full basic things - such as a high school diploma or equivalent - may be required. Also, go over your application to make sure it is complete before you submit it.
With a student to faculty ratio of 15 to 1, Charlotte Technical College is about average in this regard as the nationwide rate is 15 to 1. While this does not translate directly to class size, it's a good indicator of how much time professors will have to spend with their students on a one-on-one basis.
Charlotte Technical College has a freshmen retention rate of 79%. That's a good sign that full-time students like the school and their professors enough to want to stick around for another year. It's also a sign that the admissions team did a good job in choosing applicants who were a good fit for the school.
During the 2017-2018 academic year, there were 250 full-time undergraduates at CTC.
The net price is calculated by adding tuition, room, board and other costs and subtracting financial aid.Note that the net price is typically less than the published for a school. For more information on the sticker price of CTC, see our tuition and fees and room and board pages.
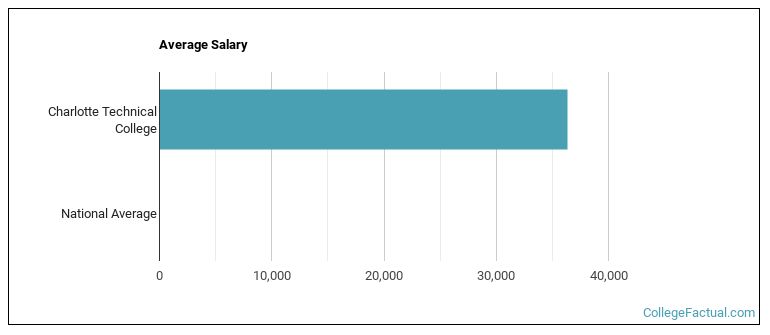
See which majors at Charlotte Technical College make the most money.
Get more details about the location of Charlotte Technical College.

Contact details for CTC are given below.
| Contact Details | |
|---|---|
| Address: | 18150 Murdock Circle, Port Charlotte, FL 33948-3399 |
| Phone: | 941-255-7500 |
| Website: | www.charlottetechcollege.net/ctc |
| Most Popular Majors | Bachelor’s Degrees | Average Salary of Graduates |
|---|---|---|
| Practical Nursing & Nursing Assistants | 69 | NA |
| Information Technology | 35 | NA |
| Allied Health Professions | 32 | NA |
| Cosmetology | 27 | NA |
| Culinary Arts | 26 | NA |
| Graphic Communications | 21 | NA |
| Environmental Control Technology | 18 | NA |
| Dental Support Services | 18 | NA |
| Fire Protection | 14 | NA |
| Vehicle Maintenance & Repair | 10 | NA |
Footnotes
*The racial-ethnic minorities count is calculated by taking the total number of students and subtracting white students, international students, and students whose race/ethnicity was unknown. This number is then divided by the total number of students at the school to obtain the racial-ethnic minorities percentage.
References
More about our data sources and methodologies.