Below are the key facts about this program at Chattahoochee Technical College. It is offered at the Associate’s, Undergraduate Certificate, Certificate levels. Jump to any of the following sections:
The table below lists every degree level granted in design & applied arts at Chattahoochee Technical College, along with how many graduates complete each level annually.
| Degree Level | Annual Graduates |
|---|---|
| Associate’s | 52 |
| Undergraduate Certificate | 41 |
| Certificate | 132 |
For the most recent IPEDS reporting year, Chattahoochee Technical College awarded 52 associate’s degrees in design & applied arts.
Chattahoochee Technical College is not currently ranked for design & applied arts at the associate’s level.
Information about average full-time undergraduate tuition and fees is shown in the table below.
| In State | Out of State | |
|---|---|---|
| Tuition | $2,400 | $5,136 |
| Fees | $972 | $972 |
Read more about Chattahoochee Technical College tuition and fees.
For the most recent academic year available, 40% of design & applied arts associate’s degrees went to men and 60% went to women.
 The largest share of design & applied arts associate’s degree graduates at Chattahoochee Technical College are White. About 58% of graduates fell into this category.
The following table and chart show the ethnic background for students who recently graduated from Chattahoochee Technical College with a associate’s in design & applied arts.
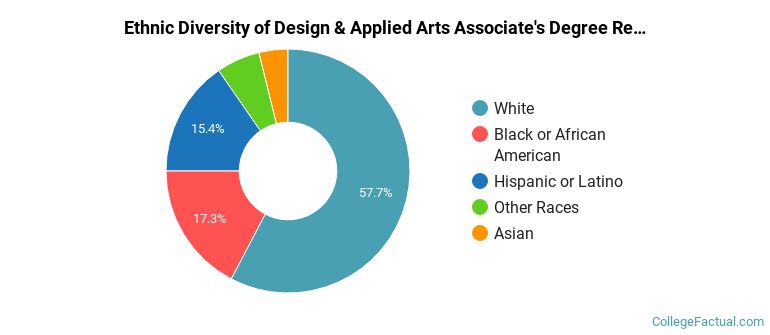
| Ethnic Background | Number of Students |
|---|---|
| Asian | 2 |
| Black or African American | 9 |
| Hispanic or Latino | 8 |
| White | 30 |
| Non-Resident Aliens | 0 |
| Other Races | 3 |
Chattahoochee Technical College conferred 34 associate’s degrees in design and visual communications, general in the latest year of data — 50% to women and 50% to men. The most common background among these graduates was White (56%).
Chattahoochee Technical College awarded 18 associate’s completions in interior design recently — 78% to women and 22% to men. Most of these graduates identified as White (61%).
During the most recent reporting year, Chattahoochee Technical College awarded 41 undergraduate certificate degrees in design & applied arts.
Chattahoochee Technical College is not yet ranked for design & applied arts at the undergraduate certificate level.
Among recent graduates, 46% of design & applied arts undergraduate certificate degrees went to men and 54% went to women.
 The largest share of design & applied arts undergraduate certificate degree graduates at Chattahoochee Technical College were White. Approximately 61% of graduates fell into this category.
The following table and chart show the ethnic background for students who recently graduated from Chattahoochee Technical College with a undergraduate certificate in design & applied arts.
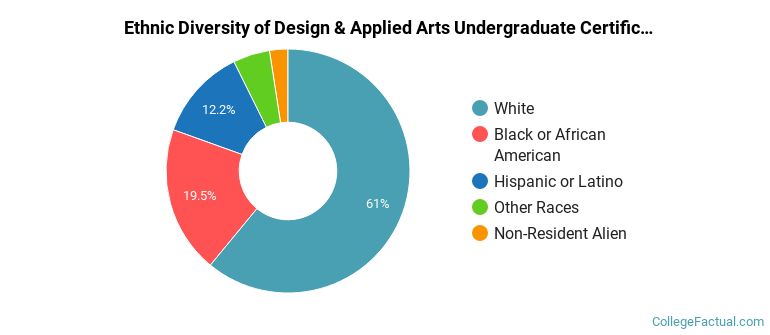
| Ethnic Background | Number of Students |
|---|---|
| Asian | 0 |
| Black or African American | 8 |
| Hispanic or Latino | 5 |
| White | 25 |
| Non-Resident Aliens | 1 |
| Other Races | 2 |
Chattahoochee Technical College conferred 31 undergraduate certificate degrees in design and visual communications, general in the latest year of data — 45% to women and 55% to men. The most common background among these graduates was White (58%).
Chattahoochee Technical College granted 10 undergraduate certificate completions in interior design recently — 80% to women and 20% to men. Most of these graduates identified as White (70%).
In the most recent year for which we have data, Chattahoochee Technical College handed out 132 certificate degrees in design & applied arts.
Chattahoochee Technical College is not currently ranked for design & applied arts at the certificate level.
In the most recent graduating class, 33% of design & applied arts certificate degrees went to men and 67% went to women.
 The majority of design & applied arts certificate degree graduates at Chattahoochee Technical College were White. Roughly 57% of graduates fell into this category.
The following table and chart show the ethnic background for students who recently graduated from Chattahoochee Technical College with a certificate in design & applied arts.
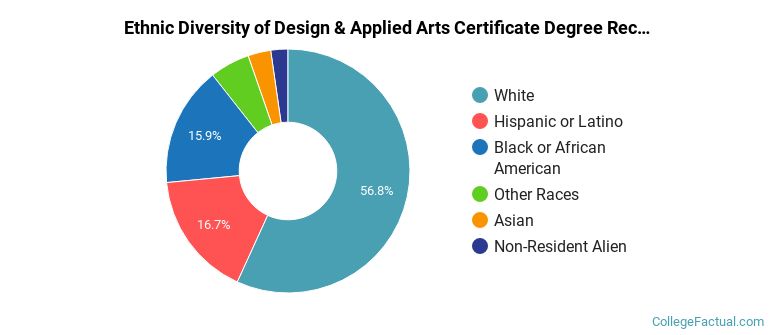
| Ethnic Background | Number of Students |
|---|---|
| Asian | 4 |
| Black or African American | 21 |
| Hispanic or Latino | 22 |
| White | 75 |
| Non-Resident Aliens | 3 |
| Other Races | 7 |
Chattahoochee Technical College conferred 83 certificate completions in design and visual communications, general in the most recent reporting year — 53% to women and 47% to men. The most common background among these graduates was White (57%).
Chattahoochee Technical College awarded 49 certificate completions in interior design in the latest year of data — 90% to women and 10% to men. The largest share of these graduates were White (57%).
More about our data sources and methodologies.