CSU total enrollment is approximately 2,644 students. 1,086 are undergraduates and 498 are graduate students.
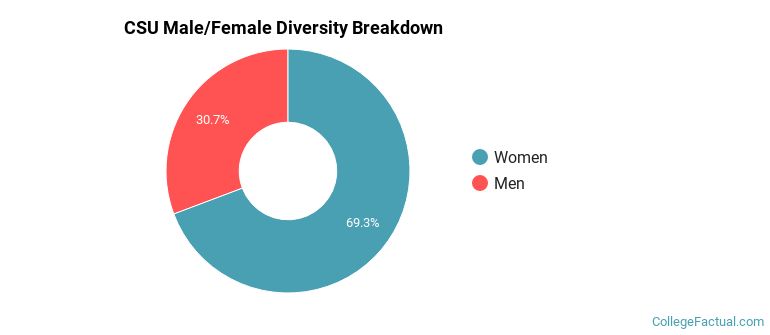
Male/Female Breakdown of Undergraduates
The full-time CSU undergraduate population is made up of 71% women, and 29% men.
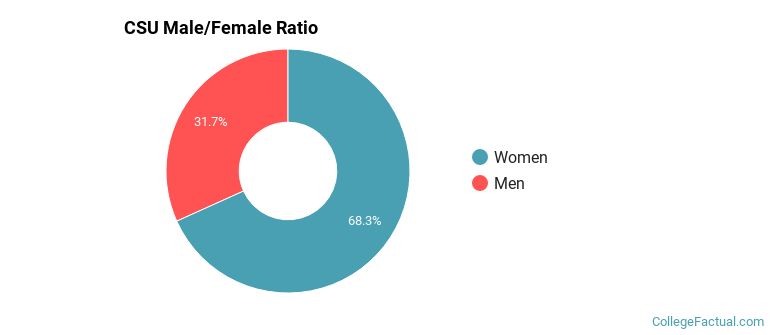
For the gender breakdown for all students, go here.
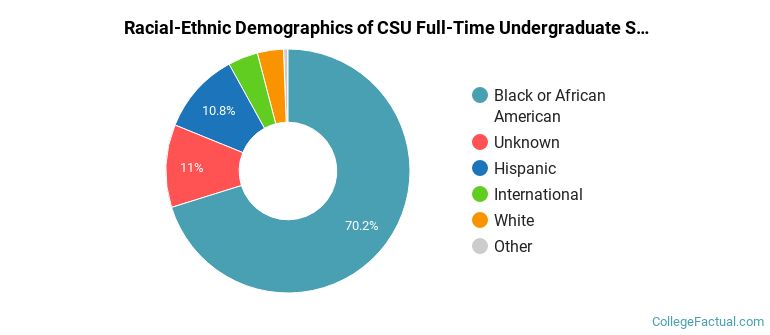
CSU Racial/Ethnic Breakdown of Undergraduates
| Race/Ethnicity | Number |
|---|---|
| Black or African American | 772 |
| Unknown | 109 |
| Hispanic | 83 |
| International | 46 |
| Multi-Ethnic | 33 |
| White | 25 |
| Asian | 11 |
| Native Hawaiian or Pacific Islander | 1 |
See racial/ethnic breakdown for all students.
Male/Female Breakdown of Graduate Students
About 67% of full-time grad students are women, and 33% men.
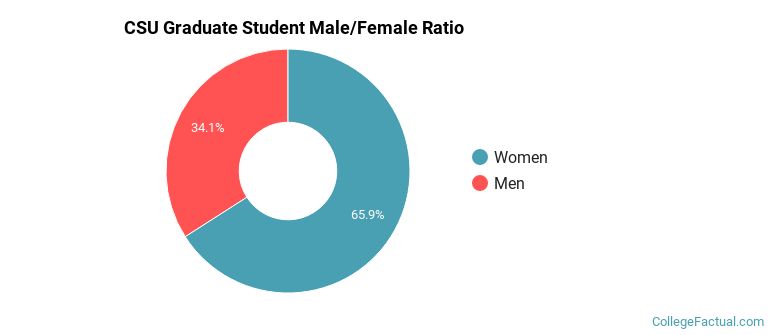
For the gender breakdown for all students, go here.
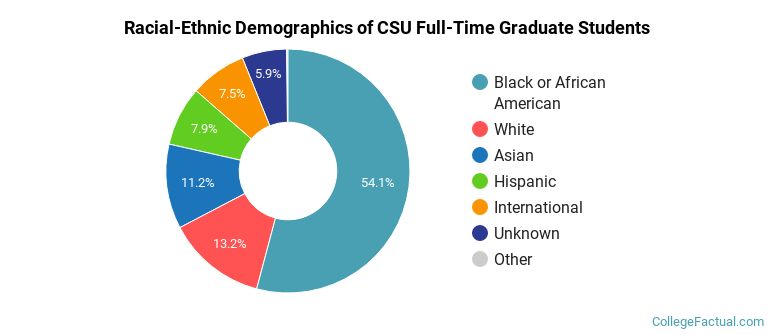
CSU Racial-Ethnic Breakdown of Graduate Students
| Race/Ethnicity | Number |
|---|---|
| Black or African American | 272 |
| White | 61 |
| Asian | 49 |
| International | 37 |
| Hispanic | 36 |
| Unknown | 27 |
| Multi-Ethnic | 12 |
| Native Hawaiian or Pacific Islander | 2 |
See racial/ethnic breakdown for all students.

| Race/Ethnicity | Number |
|---|---|
| Black or African American | 1,840 |
| Unknown | 238 |
| Hispanic | 181 |
| White | 145 |
| International | 91 |
| Asian | 70 |
| Multi-Ethnic | 65 |
| Native Hawaiian or Pacific Islander | 4 |
There are approximately 1,880 female students and 764 male students at CSU.
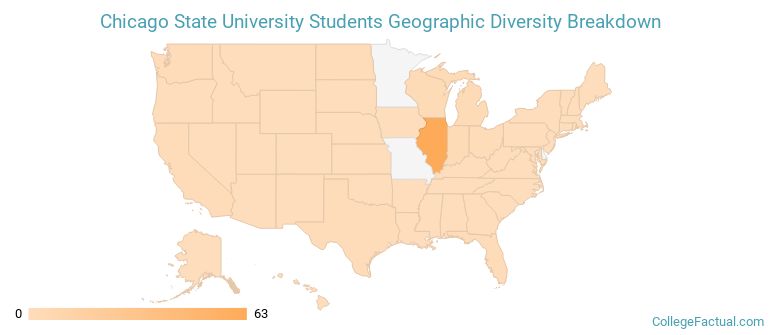
CSU ranks 1,176 out of 2,183 when it comes to geographic diversity.
23.17% of CSU students come from out of state, and 4.65% come from out of the country.
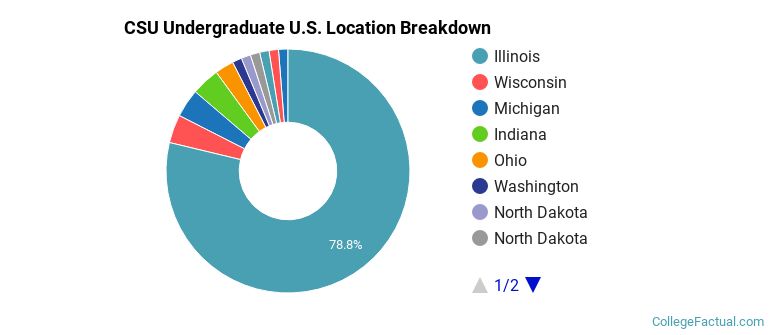
The undergraduate student body is split among 11 states (may include Washington D.C.). Click on the map for more detail.
| State | Amount |
|---|---|
| Illinois | 63 |
| Indiana | 3 |
| Michigan | 3 |
| Wisconsin | 3 |
| Ohio | 2 |
Students from 30 countries are represented at this school, with the majority of the international students coming from India, Canada, and China.
Learn more about international students at CSU.
A traditional college student is defined as being between the ages of 18-21. At CSU, 11.22% of students fall into that category, compared to the national average of 60%.
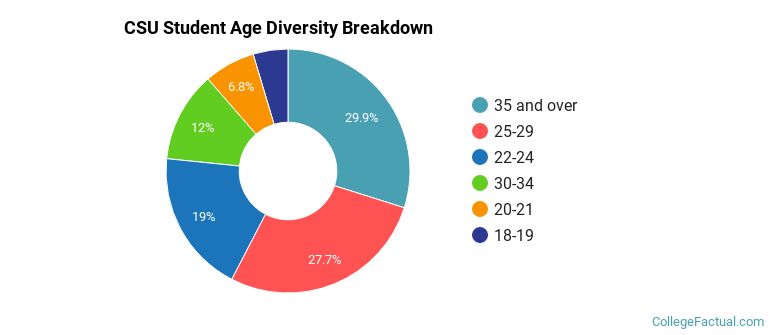
| Student Age Group | Amount |
|---|---|
| 35 and over | 912 |
| 25-29 | 847 |
| 22-24 | 580 |
| 30-34 | 366 |
| 20-21 | 207 |
| 18-19 | 141 |
| Under 18 | 0 |
Footnotes
*The racial-ethnic minorities count is calculated by taking the total number of students and subtracting white students, international students, and students whose race/ethnicity was unknown. This number is then divided by the total number of students at the school to obtain the racial-ethnic minorities percentage.
References