Explore the best ranked schools for the programs you are most interested in.
Chisholm Trail Technology Center was not ranked in College Factual's Best Overall Colleges report this year. This may be because not enough data was available.
See all of the rankings for Chisholm Trail Technology Center.
Since Chisholm Trail Technology Center has an open admissions policy, being accepted to the school isn't that hard. However, a full basic things - such as a high school diploma or equivalent - may be required. Also, go over your application to make sure it is complete before you submit it.
The student to faculty ratio is often used to measure the number of teaching resources that a college or university offers its students. The national average for this metric is 15 to 1, but at Chisholm Trail Technology Center it is much better at 5 to 1. That's good news for students who want to interact more on a personal level with their teachers.
The freshmen retention rate tells us what percentage of first-year, full-time students choose to continue on to their sophomore year at a particular school. The rate at Chisholm Trail Technology Center is 67%, which is about average when compared to the national rate of 68%.
During the 2017-2018 academic year, there were 163 undergraduates at Chisholm Trail Technology Center with 17 being full-time and 146 being part-time.
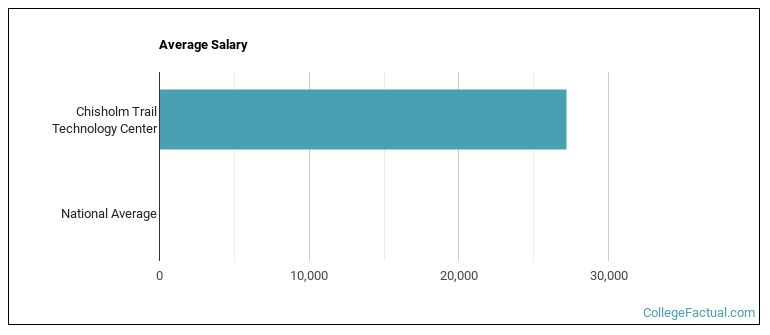
See which majors at Chisholm Trail Technology Center make the most money.
Get more details about the location of Chisholm Trail Technology Center.

Contact details for Chisholm Trail Technology Center are given below.
| Contact Details | |
|---|---|
| Address: | 283 State Highway 33, Omega, OK 73764-6335 |
| Phone: | 405-729-8324 |
| Website: | www.cttc.edu/ |
| Most Popular Majors | Bachelor’s Degrees | Average Salary of Graduates |
|---|---|---|
| Practical Nursing & Nursing Assistants | 16 | NA |
| Computer Systems Networking | 12 | NA |
| Design & Applied Arts | 11 | NA |
| Vehicle Maintenance & Repair | 10 | NA |
| Precision Metal Working | 7 | NA |
| Cosmetology | 4 | NA |
| General Engineering | 2 | NA |
| Information Technology | 1 | NA |
| Accounting | 0 | NA |
| Business Support & Assistant Services | 0 | NA |
Footnotes
*The racial-ethnic minorities count is calculated by taking the total number of students and subtracting white students, international students, and students whose race/ethnicity was unknown. This number is then divided by the total number of students at the school to obtain the racial-ethnic minorities percentage.
References
More about our data sources and methodologies.