Malcolm X College total enrollment is approximately 7,273 students.
Male/Female Breakdown of Undergraduates
The full-time Malcolm X College undergraduate population is made up of 77% women, and 23% men.
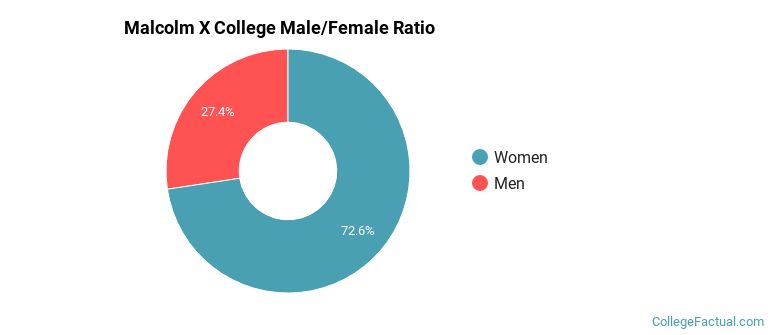
For the gender breakdown for all students, go here.
Malcolm X College Racial/Ethnic Breakdown of Undergraduates
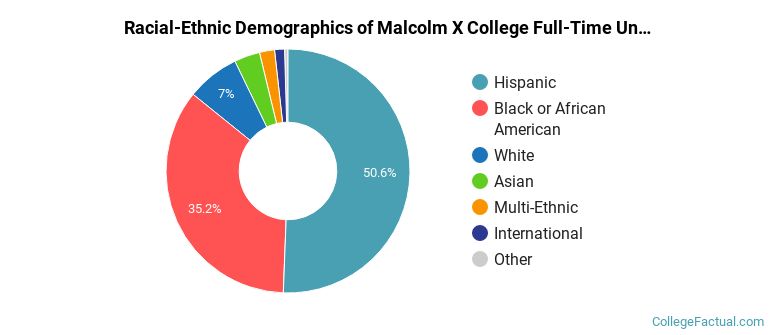
| Race/Ethnicity | Number |
|---|---|
| Hispanic | 1,491 |
| Black or African American | 905 |
| White | 202 |
| Asian | 74 |
| Multi-Ethnic | 57 |
| International | 44 |
| Unknown | 6 |
| Native Hawaiian or Pacific Islander | 4 |
See racial/ethnic breakdown for all students.
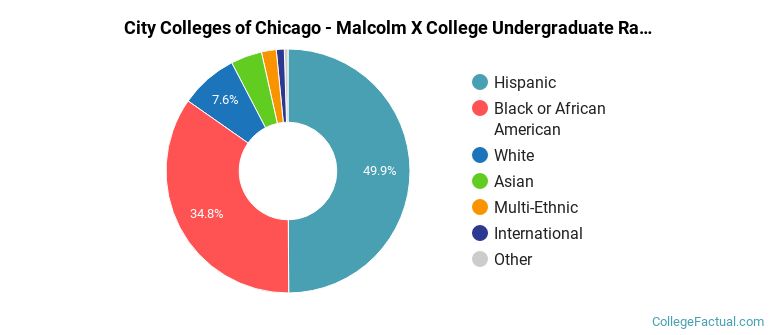
| Race/Ethnicity | Number |
|---|---|
| Hispanic | 3,664 |
| Black or African American | 2,494 |
| White | 576 |
| Asian | 263 |
| Multi-Ethnic | 154 |
| International | 69 |
| Unknown | 39 |
| Native Hawaiian or Pacific Islander | 10 |
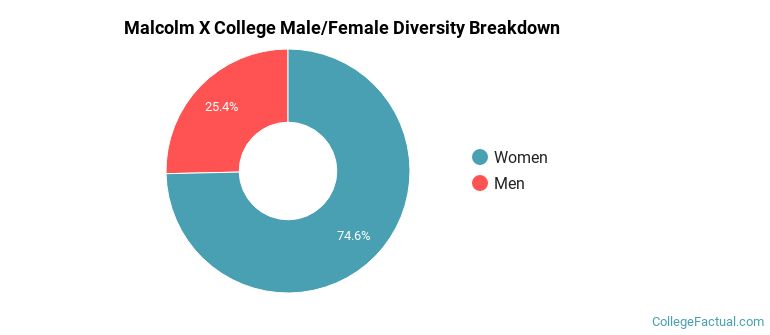
There are approximately 5,542 female students and 1,731 male students at Malcolm X College.
Learn more about international students at Malcolm X College.
A traditional college student is defined as being between the ages of 18-21. At Malcolm X College, 37.27% of students fall into that category, compared to the national average of 60%.
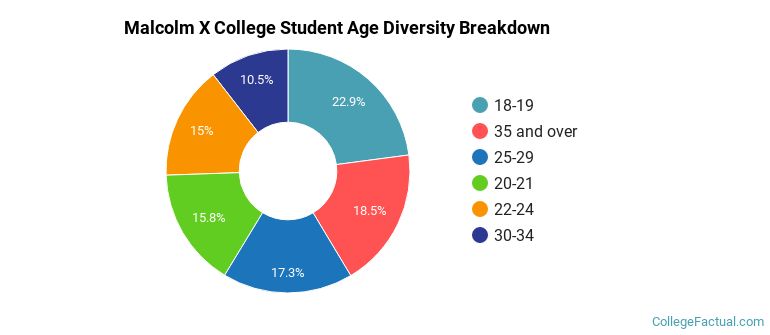
| Student Age Group | Amount |
|---|---|
| 18-19 | 1,482 |
| 35 and over | 1,197 |
| 25-29 | 1,119 |
| 20-21 | 1,020 |
| 22-24 | 973 |
| 30-34 | 680 |
| Under 18 | 0 |
Footnotes
*The racial-ethnic minorities count is calculated by taking the total number of students and subtracting white students, international students, and students whose race/ethnicity was unknown. This number is then divided by the total number of students at the school to obtain the racial-ethnic minorities percentage.
References
Department of Homeland Security Citizenship and Immigration Services
Read College Factual's Diversity Ranking Methodology.