Explore the best ranked schools for the programs you are most interested in.
Wilbur Wright College is ranked #1,502 out of 2,152 schools in the nation for overall quality on College Factual's 2025 Best Colleges list.
Wilbur Wright College is also ranked #62 out of 85 schools in Illinois.
See all of the rankings for City Colleges of Chicago - Wilbur Wright College.
City Colleges of Chicago - Wilbur Wright College has an open admissions policy, so you should not have much trouble being accepted by the school. Still, it is important to fill out the application completely and submit any requested materials, which may include proof that you have a high school diploma or the equivalent.
The student to faculty ratio at City Colleges of Chicago - Wilbur Wright College is 29 to 1, which is high when compared to the national average of 15 to 1. This may indicate that some of your classes will be larger in size than they would be at other schools. However, upper level classes will probably be smaller.
Another measure that is often used to estimate how much access students will have to their professors is how many faculty members are full-time. The idea here is that part-time faculty tend to spend less time on campus, so they may not be as available to students as full-timers.
The full-time faculty percentage at City Colleges of Chicago - Wilbur Wright College is 28%. This is lower than the national average of 47%.
The freshmen retention rate tells us what percentage of first-year, full-time students choose to continue on to their sophomore year at a particular school. The rate at City Colleges of Chicago - Wilbur Wright College is 67%, which is about average when compared to the national rate of 68%.
During the 2017-2018 academic year, there were 7,946 undergraduates at Wilbur Wright College with 3,113 being full-time and 4,833 being part-time.
| $0-30 K | $30K-48K | $48-75 | $75-110K | $110K + |
|---|---|---|---|---|
| $2,620 | $3,387 | $5,459 | $7,546 | $7,014 |
The net price is calculated by adding tuition, room, board and other costs and subtracting financial aid.Note that the net price is typically less than the published for a school. For more information on the sticker price of Wilbur Wright College, see our tuition and fees and room and board pages.
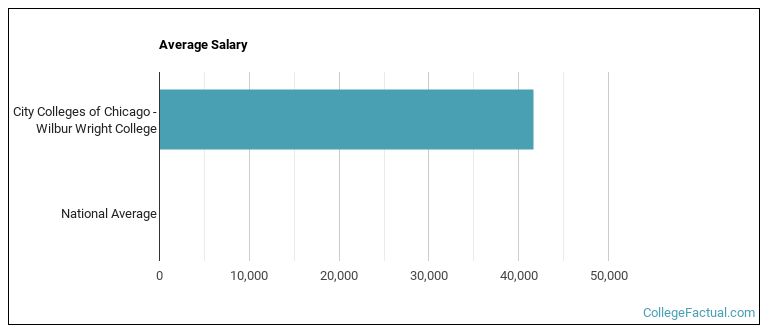
See which majors at City Colleges of Chicago - Wilbur Wright College make the most money.
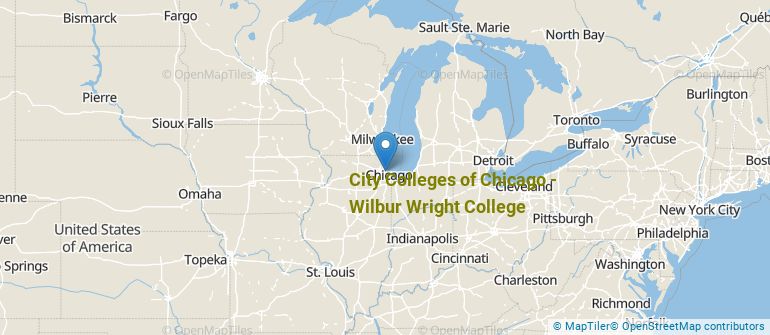
Get more details about the location of City Colleges of Chicago - Wilbur Wright College.
Contact details for Wilbur Wright College are given below.
| Contact Details | |
|---|---|
| Address: | 4300 N Narragansett, Chicago, IL 60634-1500 |
| Phone: | 773-777-7900 |
| Website: | ccc.edu/colleges/wright/pages/default.aspx |
| Most Popular Majors | Bachelor’s Degrees | Average Salary of Graduates |
|---|---|---|
| Liberal Arts General Studies | 942 | NA |
| Biological & Physical Science | 140 | NA |
| Information Technology | 48 | NA |
| General Engineering | 45 | NA |
| Allied Health & Medical Assisting Services | 35 | NA |
| Criminal Justice & Corrections | 33 | NA |
| Computer Systems Networking | 32 | NA |
| Precision Metal Working | 30 | NA |
| Legal Support Services | 25 | NA |
| Information Science | 16 | NA |
Online learning is becoming popular at even the oldest colleges and universities in the United States. Not only are online classes great for returning adults with busy schedules, they are also frequented by a growing number of traditional students.
In 2022-2023, 3,467 students took at least one online class at City Colleges of Chicago - Wilbur Wright College. This is a decrease from the 4,812 students who took online classes the previous year.
| Year | Took at Least One Online Class | Took All Classes Online |
|---|---|---|
| 2022-2023 | 3,467 | 2,003 |
| 2021-2022 | 4,812 | 3,920 |
| 2020-2021 | 7,891 | 7,736 |
| 2018-2019 | 1,031 | 334 |
Learn more about online learning at City Colleges of Chicago - Wilbur Wright College.
Footnotes
*The racial-ethnic minorities count is calculated by taking the total number of students and subtracting white students, international students, and students whose race/ethnicity was unknown. This number is then divided by the total number of students at the school to obtain the racial-ethnic minorities percentage.
References
More about our data sources and methodologies.