C of C total enrollment is approximately 10,384 students. 8,466 are undergraduates and 288 are graduate students.
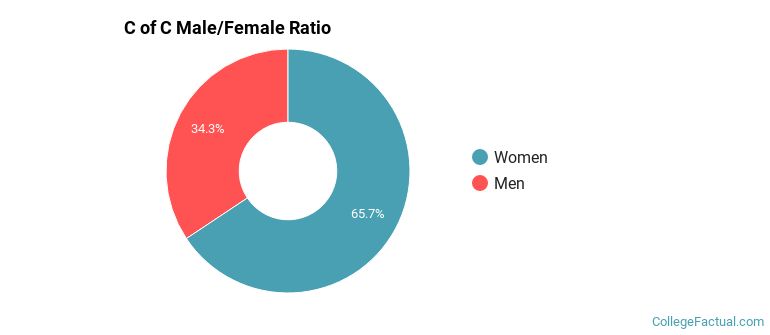
Male/Female Breakdown of Undergraduates
The full-time C of C undergraduate population is made up of 67% women, and 33% men.
For the gender breakdown for all students, go here.
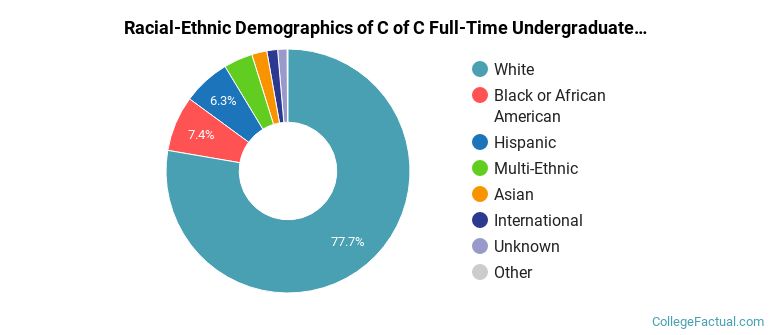
C of C Racial/Ethnic Breakdown of Undergraduates
| Race/Ethnicity | Number |
|---|---|
| White | 6,585 |
| Hispanic | 594 |
| Black or African American | 568 |
| Multi-Ethnic | 331 |
| Asian | 173 |
| Unknown | 102 |
| International | 77 |
| Native Hawaiian or Pacific Islander | 8 |
See racial/ethnic breakdown for all students.
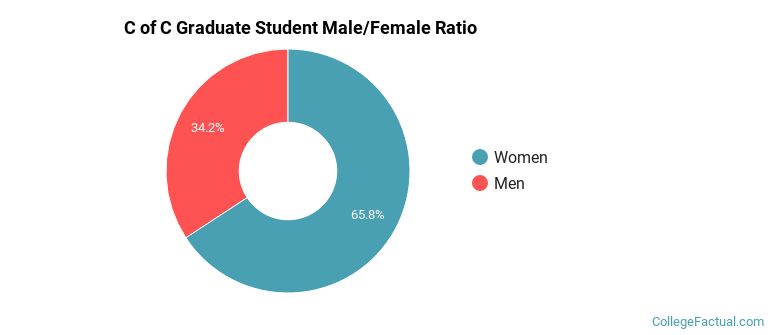
Male/Female Breakdown of Graduate Students
About 62% of full-time grad students are women, and 38% men.
For the gender breakdown for all students, go here.
C of C Racial-Ethnic Breakdown of Graduate Students

| Race/Ethnicity | Number |
|---|---|
| White | 222 |
| Black or African American | 17 |
| Hispanic | 15 |
| Unknown | 11 |
| International | 10 |
| Multi-Ethnic | 10 |
| Asian | 2 |
| Native Hawaiian or Pacific Islander | 1 |
See racial/ethnic breakdown for all students.
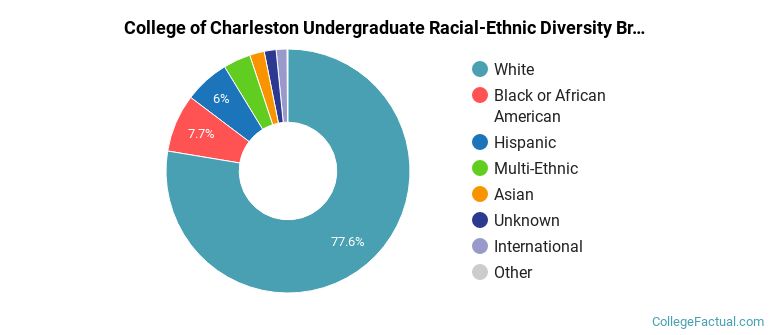
| Race/Ethnicity | Number |
|---|---|
| White | 8,028 |
| Black or African American | 767 |
| Hispanic | 693 |
| Multi-Ethnic | 385 |
| Asian | 201 |
| Unknown | 172 |
| International | 96 |
| Native Hawaiian or Pacific Islander | 11 |

There are approximately 6,904 female students and 3,480 male students at C of C.
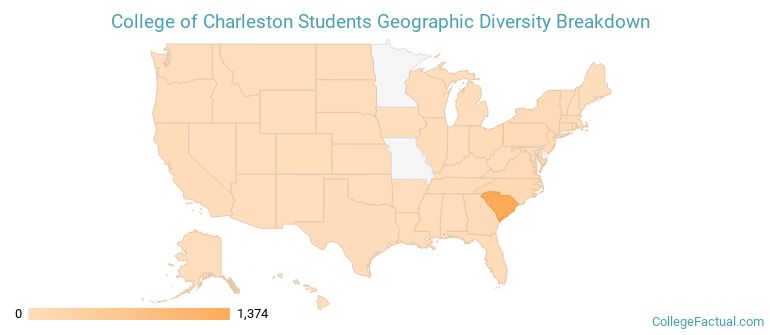
C of C ranks 361 out of 2,183 when it comes to geographic diversity.
40.95% of C of C students come from out of state, and 0.68% come from out of the country.
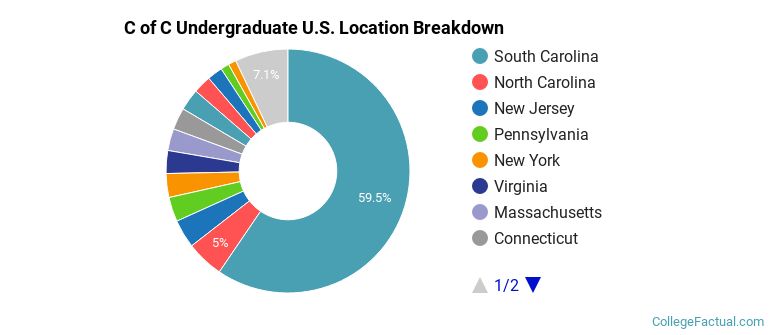
The undergraduate student body is split among 39 states (may include Washington D.C.). Click on the map for more detail.
| State | Amount |
|---|---|
| South Carolina | 1,374 |
| North Carolina | 115 |
| New Jersey | 87 |
| Pennsylvania | 75 |
| New York | 73 |
Students from 47 countries are represented at this school, with the majority of the international students coming from Japan, Germany, and China.
Learn more about international students at C of C.
A traditional college student is defined as being between the ages of 18-21. At C of C, 69.68% of students fall into that category, compared to the national average of 60%.
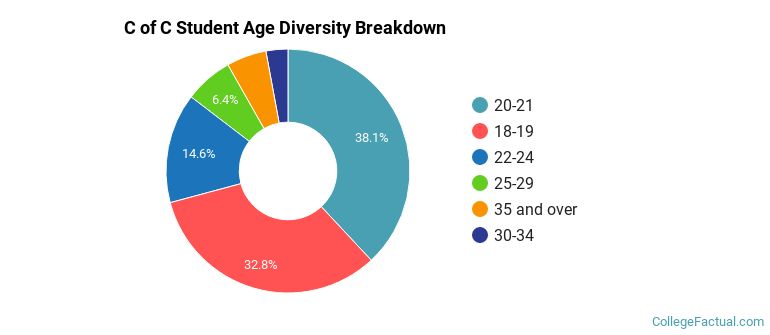
| Student Age Group | Amount |
|---|---|
| 20-21 | 4,067 |
| 18-19 | 3,502 |
| 22-24 | 1,557 |
| 25-29 | 685 |
| 35 and over | 566 |
| 30-34 | 311 |
| Under 18 | 0 |
Footnotes
*The racial-ethnic minorities count is calculated by taking the total number of students and subtracting white students, international students, and students whose race/ethnicity was unknown. This number is then divided by the total number of students at the school to obtain the racial-ethnic minorities percentage.
References
Department of Homeland Security Citizenship and Immigration Services
Find out how College Factual created their Diversity Rankings.