NDMU total enrollment is approximately 2,233 students. 563 are undergraduates and 391 are graduate students.
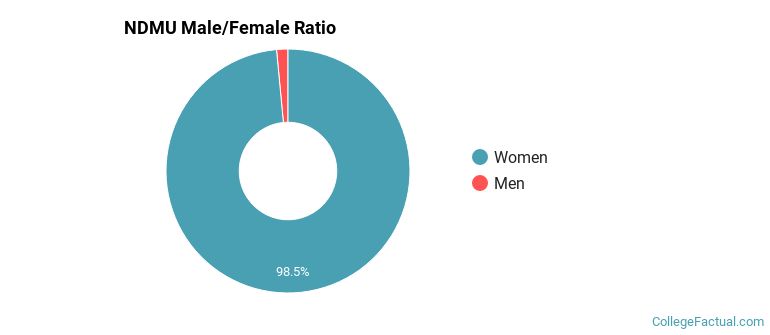
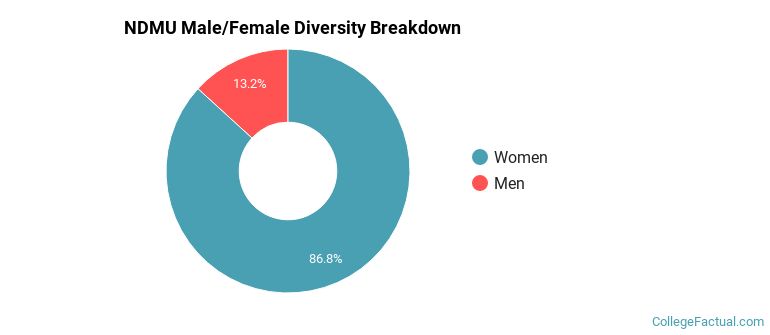
Male/Female Breakdown of Undergraduates
The full-time NDMU undergraduate population is made up of 97% women, and 3% men.
For the gender breakdown for all students, go here.
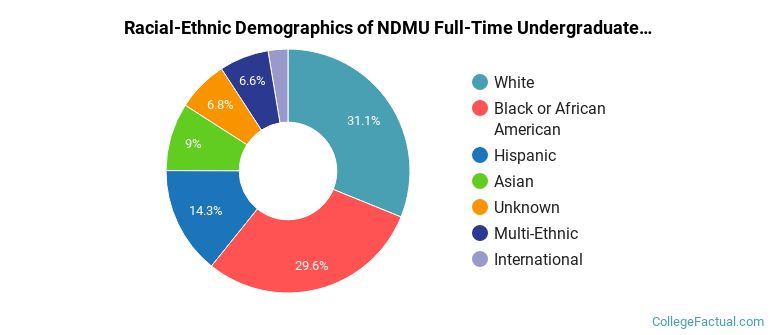
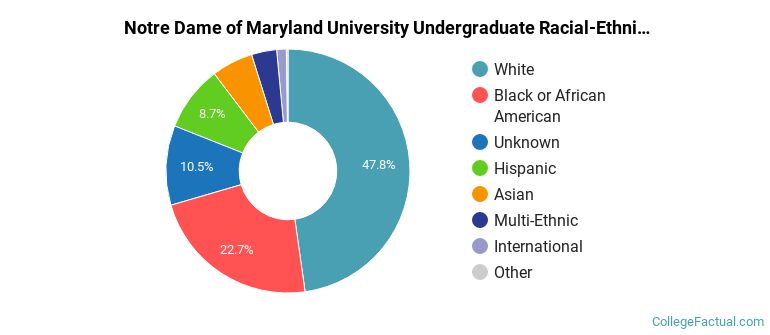
NDMU Racial/Ethnic Breakdown of Undergraduates
| Race/Ethnicity | Number |
|---|---|
| White | 212 |
| Black or African American | 125 |
| Unknown | 87 |
| Hispanic | 79 |
| Asian | 30 |
| Multi-Ethnic | 20 |
| International | 9 |
| Native Hawaiian or Pacific Islander | 0 |
See racial/ethnic breakdown for all students.
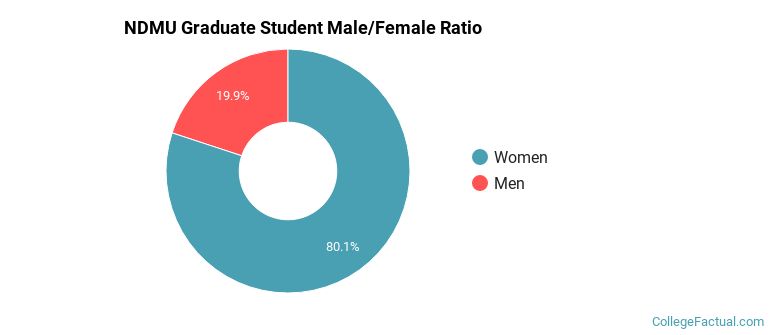
Male/Female Breakdown of Graduate Students
About 81% of full-time grad students are women, and 19% men.
For the gender breakdown for all students, go here.
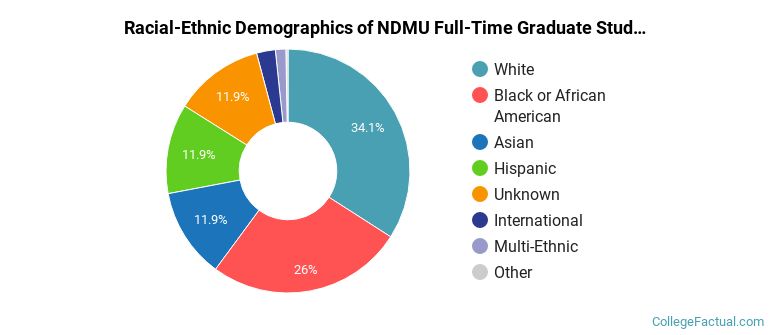
NDMU Racial-Ethnic Breakdown of Graduate Students
| Race/Ethnicity | Number |
|---|---|
| White | 158 |
| Black or African American | 76 |
| Unknown | 66 |
| Hispanic | 52 |
| Asian | 13 |
| Multi-Ethnic | 13 |
| International | 10 |
| Native Hawaiian or Pacific Islander | 0 |
See racial/ethnic breakdown for all students.
| Race/Ethnicity | Number |
|---|---|
| White | 1,009 |
| Black or African American | 461 |
| Unknown | 333 |
| Hispanic | 211 |
| Asian | 114 |
| Multi-Ethnic | 78 |
| International | 20 |
| Native Hawaiian or Pacific Islander | 0 |
There are approximately 1,927 female students and 306 male students at NDMU.
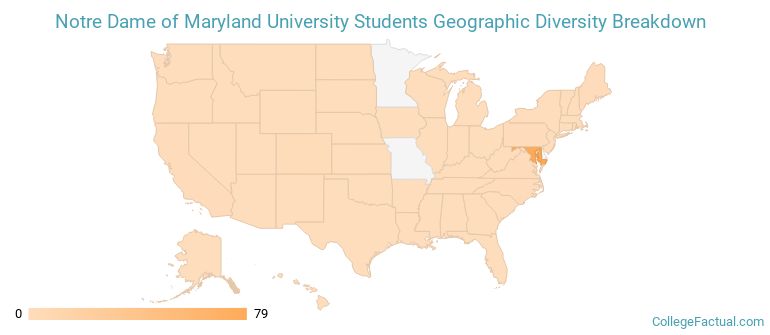
NDMU ranks 1,432 out of 2,183 when it comes to geographic diversity.
11.24% of NDMU students come from out of state, and 3.23% come from out of the country.
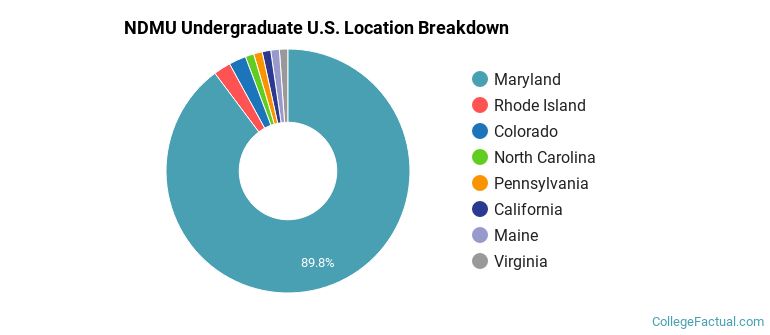
The undergraduate student body is split among 8 states (may include Washington D.C.). Click on the map for more detail.
| State | Amount |
|---|---|
| Maryland | 79 |
| Colorado | 2 |
| Rhode Island | 2 |
| California | 1 |
| Maine | 1 |
Students from 36 countries are represented at this school, with the majority of the international students coming from Saudi Arabia, Mexico, and Taiwan.
Learn more about international students at NDMU.
A traditional college student is defined as being between the ages of 18-21. At NDMU, 15.43% of students fall into that category, compared to the national average of 60%.
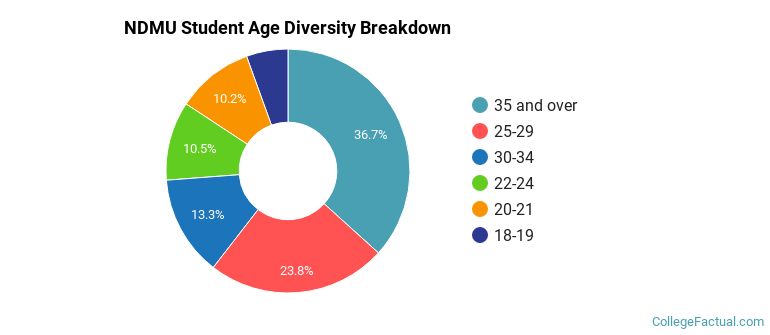
| Student Age Group | Amount |
|---|---|
| 35 and over | 891 |
| 25-29 | 577 |
| 30-34 | 323 |
| 22-24 | 254 |
| 20-21 | 248 |
| 18-19 | 134 |
| Under 18 | 0 |
Footnotes
*The racial-ethnic minorities count is calculated by taking the total number of students and subtracting white students, international students, and students whose race/ethnicity was unknown. This number is then divided by the total number of students at the school to obtain the racial-ethnic minorities percentage.
References
Department of Homeland Security Citizenship and Immigration Services
Image Credit: By Flickr user: sneakerdog under License
Find out how College Factual created their Diversity Rankings.