We’ve pulled together the essential facts you should know about the program at CSN. It is offered at the Associate’s level. Its best result is a rank of #1 out of 4 schools (Associate’s level) by College Factual. Jump to any of the following sections:
By College Factual’s measure, CSN highly for liberal arts & humanities, coming in at #357 out of 1,506 schools nationally.
| Ranking | Rank |
|---|---|
| Best Liberal Arts / Sciences & Humanities Schools | 357 of 1,506 |
| Best Liberal Arts / Sciences & Humanities Schools in Nevada | 2 of 5 |
The table below lists every degree level available for liberal arts & humanities at CSN, along with how many graduates complete each level annually.
| Degree Level | Annual Graduates |
|---|---|
| Associate’s | 1,073 |
This liberal arts & humanities area of study at CSN includes the following specific majors. Choose a major for its full rankings, popularity, and outcomes:
| Major | Annual Graduates |
|---|---|
| Liberal Arts and Sciences, General Studies and Humanities | 1,073 |
During the most recent reporting year, College of Southern Nevada awarded 1,073 associate’s degrees in liberal arts & humanities.
CSN is among the very best schools in the country for liberal arts & humanities at the associate’s level. Its best result was #1 out of 4 schools by College Factual.
Average full-time tuition and fees are listed in the table below.
| In State | Out of State | |
|---|---|---|
| Tuition | $3,293 | $12,379 |
| Fees | $645 | $645 |
Learn more about CSN tuition and fees.
Among recent graduates, 32% of liberal arts & humanities associate’s degrees went to men and 68% went to women.
 The majority of liberal arts & humanities associate’s degree graduates at CSN are Hispanic or Latino. Approximately 34% of graduates fell into this category.
The following table and chart show the ethnic background for students who recently graduated from College of Southern Nevada with a associate’s in liberal arts & humanities.
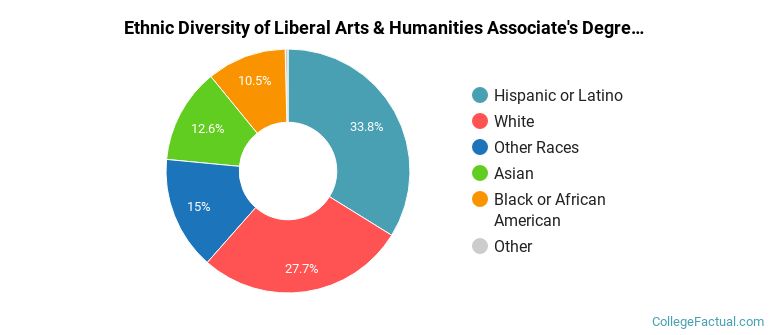
| Ethnic Background | Number of Students |
|---|---|
| Asian | 135 |
| Black or African American | 113 |
| Hispanic or Latino | 363 |
| White | 297 |
| Non-Resident Aliens | 4 |
| Other Races | 161 |
More about our data sources and methodologies.