William & Mary total enrollment is approximately 8,939 students. 6,131 are undergraduates and 1,700 are graduate students.
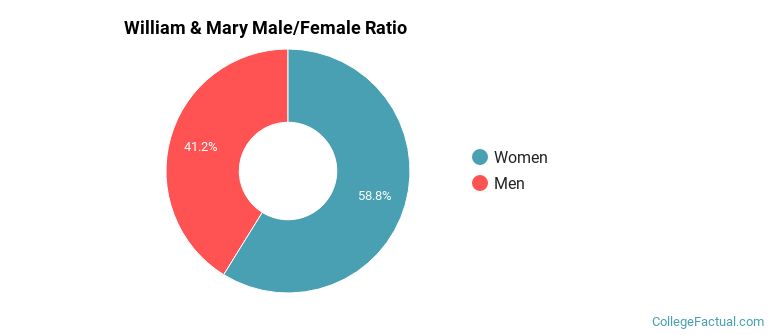
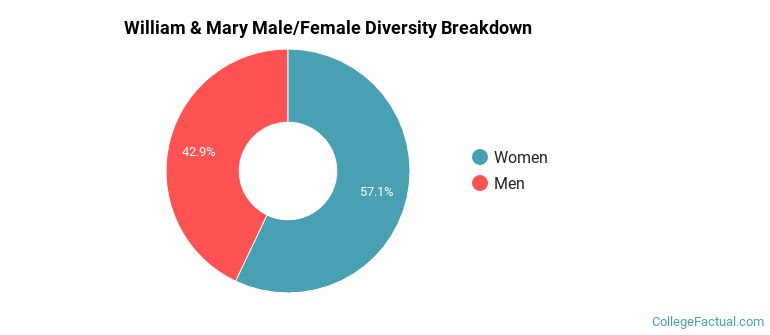
Male/Female Breakdown of Undergraduates
The full-time William & Mary undergraduate population is made up of 59% women, and 41% men.
For the gender breakdown for all students, go here.
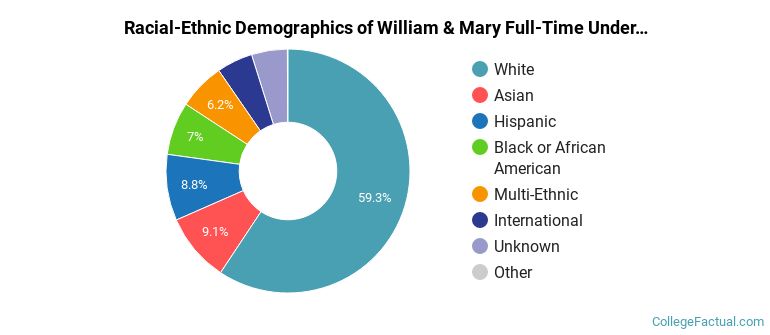
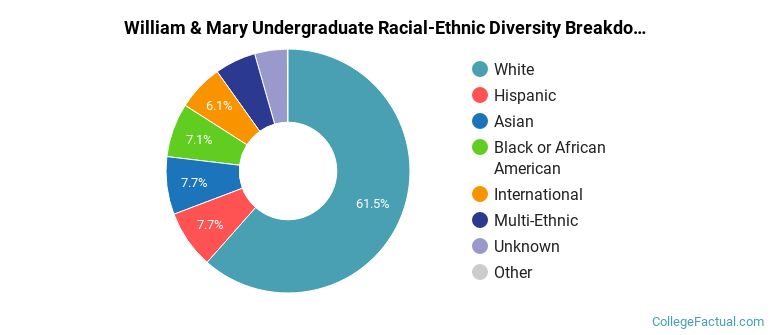
William & Mary Racial/Ethnic Breakdown of Undergraduates
| Race/Ethnicity | Number |
|---|---|
| White | 3,632 |
| Asian | 557 |
| Hispanic | 537 |
| Black or African American | 430 |
| Multi-Ethnic | 379 |
| International | 292 |
| Unknown | 291 |
| Native Hawaiian or Pacific Islander | 5 |
See racial/ethnic breakdown for all students.
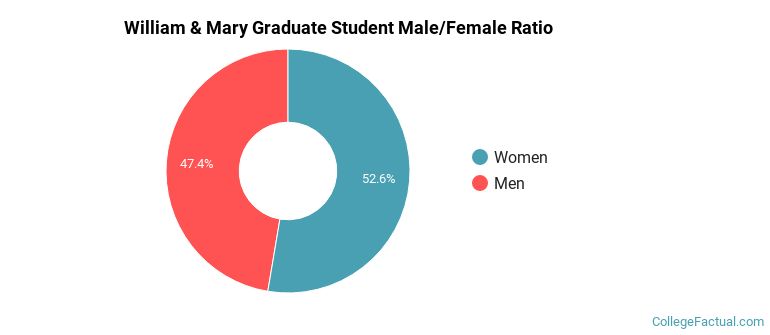
Male/Female Breakdown of Graduate Students
About 53% of full-time grad students are women, and 47% men.
For the gender breakdown for all students, go here.
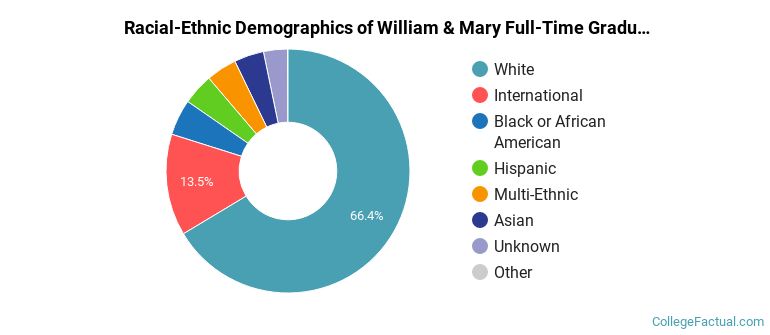
William & Mary Racial-Ethnic Breakdown of Graduate Students
| Race/Ethnicity | Number |
|---|---|
| White | 1,128 |
| International | 229 |
| Black or African American | 81 |
| Hispanic | 70 |
| Multi-Ethnic | 69 |
| Asian | 67 |
| Unknown | 54 |
| Native Hawaiian or Pacific Islander | 1 |
See racial/ethnic breakdown for all students.
| Race/Ethnicity | Number |
|---|---|
| White | 5,492 |
| Hispanic | 687 |
| Asian | 683 |
| Black or African American | 638 |
| International | 545 |
| Multi-Ethnic | 486 |
| Unknown | 387 |
| Native Hawaiian or Pacific Islander | 7 |
There are approximately 5,100 female students and 3,839 male students at William & Mary.
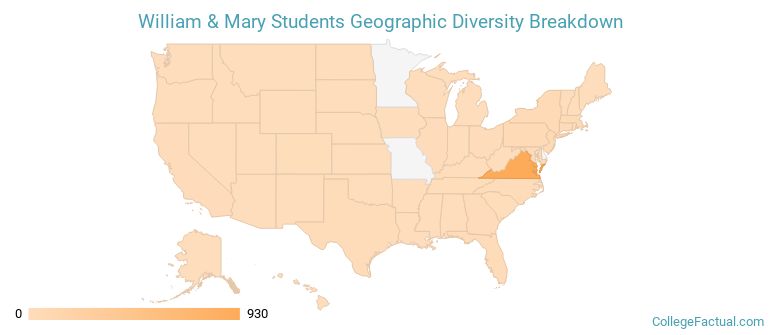
William & Mary ranks 461 out of 2,183 when it comes to geographic diversity.
33.15% of William & Mary students come from out of state, and 5.91% come from out of the country.
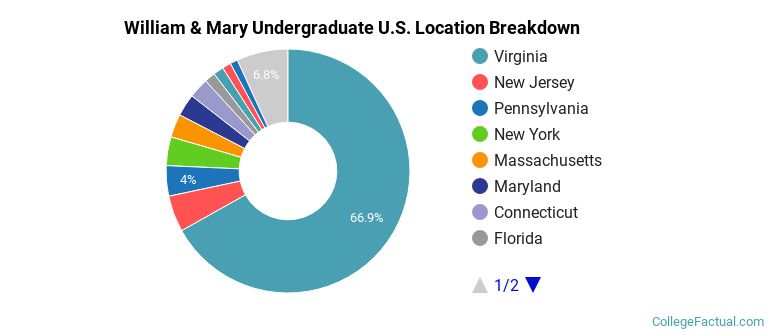
The undergraduate student body is split among 37 states (may include Washington D.C.). Click on the map for more detail.
| State | Amount |
|---|---|
| Virginia | 930 |
| New Jersey | 67 |
| Pennsylvania | 56 |
| New York | 53 |
| Massachusetts | 43 |
Students from 73 countries are represented at this school, with the majority of the international students coming from China, India, and South Korea.
Learn more about international students at William & Mary.
A traditional college student is defined as being between the ages of 18-21. At William & Mary, 66.53% of students fall into that category, compared to the national average of 60%.
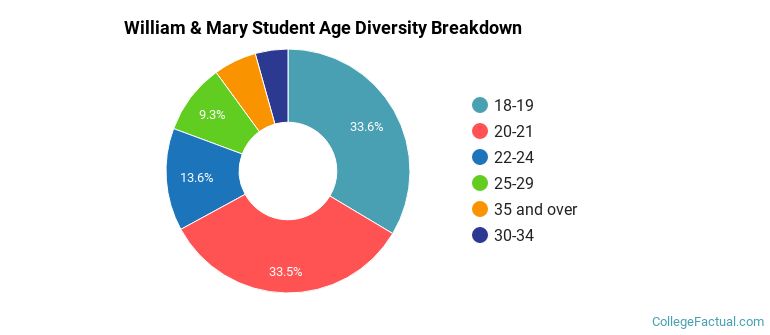
| Student Age Group | Amount |
|---|---|
| 18-19 | 2,911 |
| 20-21 | 2,904 |
| 22-24 | 1,178 |
| 25-29 | 808 |
| 35 and over | 494 |
| 30-34 | 376 |
| Under 18 | 0 |
Footnotes
*The racial-ethnic minorities count is calculated by taking the total number of students and subtracting white students, international students, and students whose race/ethnicity was unknown. This number is then divided by the total number of students at the school to obtain the racial-ethnic minorities percentage.
References
Department of Homeland Security Citizenship and Immigration Services
Find out how College Factual created their Diversity Rankings.