Explore the best ranked schools for the programs you are most interested in.
Colorado Technical University - Colorado Springs was not ranked in College Factual's Best Overall Colleges report this year. This may be because not enough data was available.
See all of the rankings for Colorado Technical University - Colorado Springs.
Colorado Technical University - Colorado Springs has an open admissions policy, so you should not have much trouble being accepted by the school. Still, it is important to fill out the application completely and submit any requested materials, which may include proof that you have a high school diploma or the equivalent.
The student to faculty ratio is often used as a measure to gauge how much access students will have to their professors - the lower the number, the better. At Colorado Technical University - Colorado Springs, this rate is 31 to 1, which is high when compared to the national average of 15 to 1.
The freshmen retention rate is a measure of what percentage of first-year, full-time students come back for their sophomore year. The 46% rate at Colorado Technical University - Colorado Springs is a good bit lower than the national rate of 68%. This could be for a number of reasons, such as students transferring after a year because they changed majors.
The on-time graduation rate is the percent of first-time, full time students who obtain their bachelor's degree in four years or less. This rate is 17% for first-time, full-time students at Colorado Technical University - Colorado Springs, which is lower than the national rate of 33.3%.
During the 2017-2018 academic year, there were 24,759 undergraduates at Colorado Technical University - Colorado Springs with 15,135 being full-time and 9,624 being part-time.
| $0-30 K | $30K-48K | $48-75 | $75-110K | $110K + |
|---|---|---|---|---|
| $16,103 | $16,997 | $18,482 | $19,666 | $20,598 |
The net price is calculated by adding tuition, room, board and other costs and subtracting financial aid.Note that the net price is typically less than the published for a school. For more information on the sticker price of Colorado Technical University - Colorado Springs, see our tuition and fees and room and board pages.
While almost two-thirds of students nationwide take out loans to pay for college, the percentage may be quite different for the school you plan on attending. At Colorado Technical University - Colorado Springs, approximately 83% of students took out student loans averaging $6,320 a year. That adds up to $25,280 over four years for those students.
Get more details about paying for Colorado Technical University - Colorado Springs.
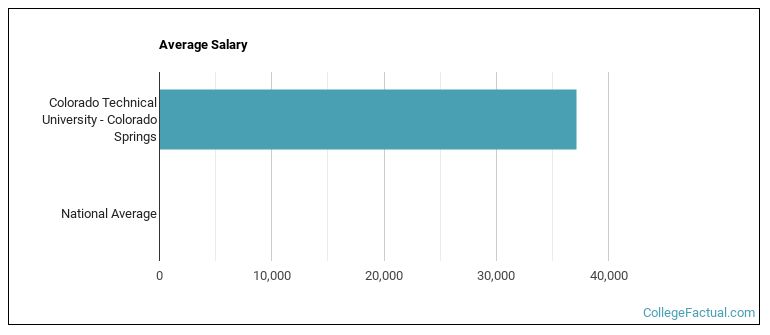
See which majors at Colorado Technical University - Colorado Springs make the most money.
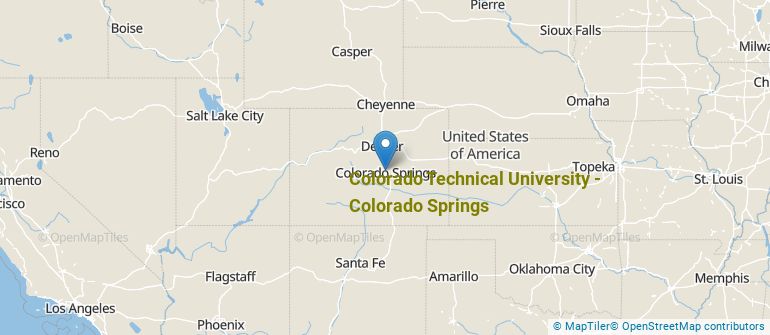
Get more details about the location of Colorado Technical University - Colorado Springs.
Contact details for Colorado Technical University - Colorado Springs are given below.
| Contact Details | |
|---|---|
| Address: | 1575 Garden Of The Gods Road, Suite 100, Colorado Springs, CO 80907-3812 |
| Phone: | 719-598-0200 |
| Website: | www.coloradotech.edu/Colorado-Springs |
| Most Popular Majors | Bachelor’s Degrees | Average Salary of Graduates |
|---|---|---|
| Business Administration & Management | 4,314 | $53,147 |
| Health & Medical Administrative Services | 1,008 | $42,511 |
| Criminal Justice & Corrections | 551 | $38,817 |
| Nursing | 437 | $87,579 |
| Computer Science | 381 | $67,531 |
| Accounting | 357 | $42,370 |
| Computer Information Systems | 344 | $60,377 |
| Information Technology | 119 | $58,911 |
| General Business/Commerce | 95 | $37,212 |
| Management Information Systems | 7 | NA |
Online courses area a great option for busy, working students as well as for those who have scheduling conflicts and want to study on their own time. As time goes by, expect to see more and more online learning options become available.
In 2022-2023, 24,783 students took at least one online class at Colorado Technical University - Colorado Springs. This is an increase from the 23,989 students who took online classes the previous year.
| Year | Took at Least One Online Class | Took All Classes Online |
|---|---|---|
| 2022-2023 | 24,783 | 24,674 |
| 2021-2022 | 23,989 | 23,963 |
| 2020-2021 | 28,211 | 28,183 |
| 2018-2019 | 25,924 | 25,038 |
Learn more about online learning at Colorado Technical University - Colorado Springs.
If you’re considering Colorado Technical University - Colorado Springs, here are some more schools you may be interested in knowing more about.
Curious on how these schools stack up against Colorado Technical University - Colorado Springs? Pit them head to head with College Combat, our free interactive tool that lets you compare college on the features that matter most to you!
Footnotes
*The racial-ethnic minorities count is calculated by taking the total number of students and subtracting white students, international students, and students whose race/ethnicity was unknown. This number is then divided by the total number of students at the school to obtain the racial-ethnic minorities percentage.
References
More about our data sources and methodologies.