Columbia total enrollment is approximately 6,769 students. 6,117 are undergraduates and 185 are graduate students.
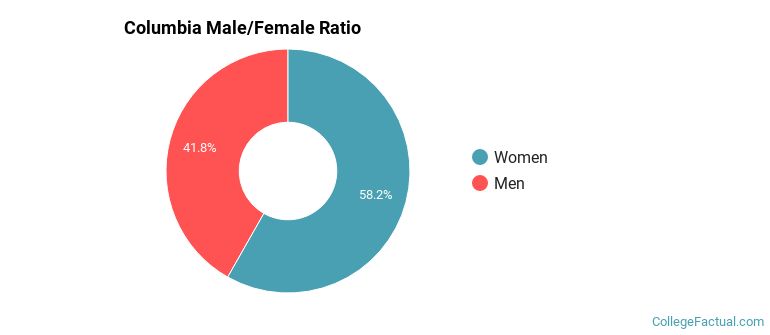
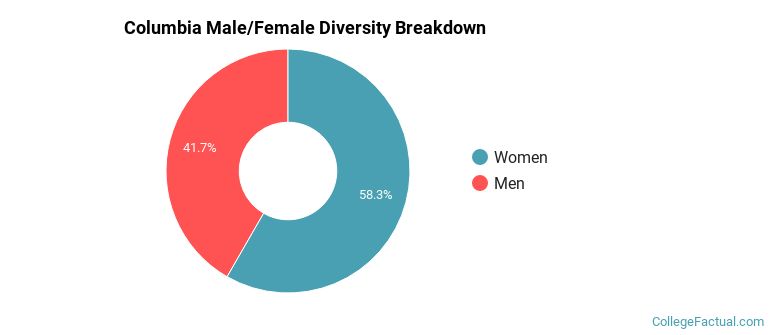
Male/Female Breakdown of Undergraduates
The full-time Columbia undergraduate population is made up of 59% women, and 41% men.
For the gender breakdown for all students, go here.
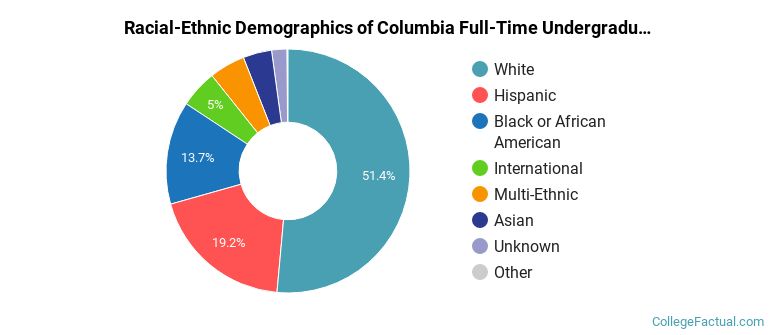
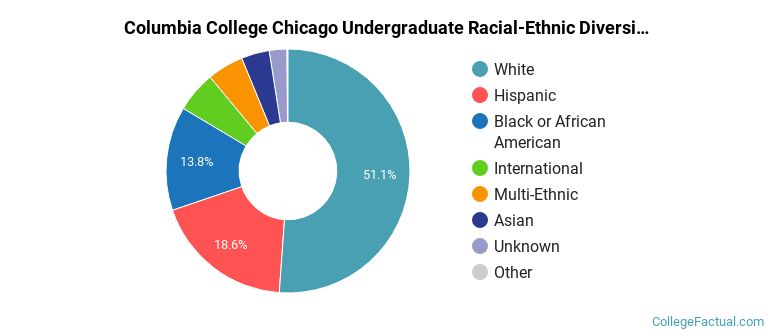
Columbia Racial/Ethnic Breakdown of Undergraduates
| Race/Ethnicity | Number |
|---|---|
| White | 2,946 |
| Hispanic | 1,427 |
| Black or African American | 923 |
| Multi-Ethnic | 284 |
| Asian | 230 |
| International | 194 |
| Unknown | 94 |
| Native Hawaiian or Pacific Islander | 7 |
See racial/ethnic breakdown for all students.
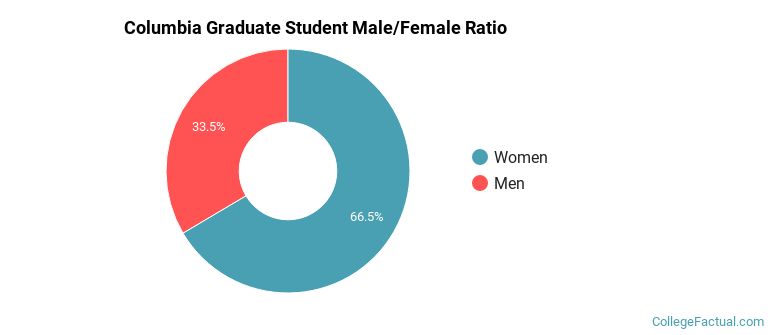
Male/Female Breakdown of Graduate Students
About 62% of full-time grad students are women, and 38% men.
For the gender breakdown for all students, go here.
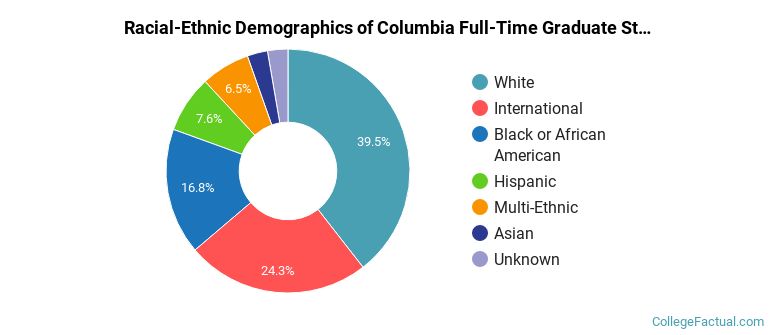
Columbia Racial-Ethnic Breakdown of Graduate Students
| Race/Ethnicity | Number |
|---|---|
| White | 81 |
| International | 41 |
| Black or African American | 33 |
| Hispanic | 17 |
| Multi-Ethnic | 7 |
| Asian | 4 |
| Unknown | 2 |
| Native Hawaiian or Pacific Islander | 0 |
See racial/ethnic breakdown for all students.
| Race/Ethnicity | Number |
|---|---|
| White | 3,254 |
| Hispanic | 1,524 |
| Black or African American | 1,044 |
| Multi-Ethnic | 307 |
| International | 262 |
| Asian | 249 |
| Unknown | 108 |
| Native Hawaiian or Pacific Islander | 8 |
There are approximately 4,006 female students and 2,763 male students at Columbia.
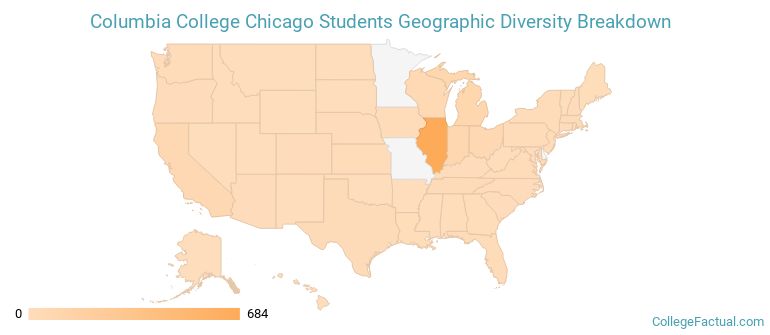
Columbia ranks 166 out of 2,183 when it comes to geographic diversity.
54.25% of Columbia students come from out of state, and 3.28% come from out of the country.
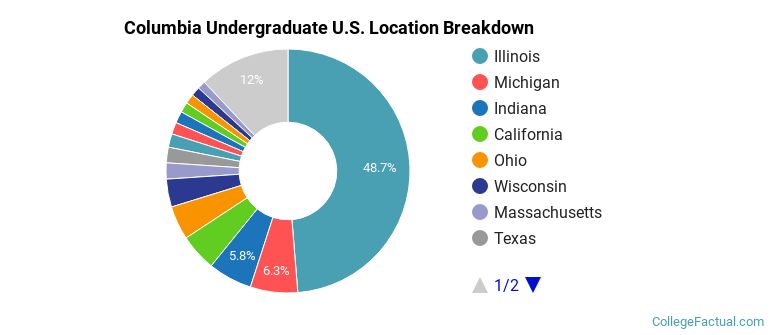
The undergraduate student body is split among 48 states (may include Washington D.C.). Click on the map for more detail.
| State | Amount |
|---|---|
| Illinois | 684 |
| Michigan | 88 |
| Indiana | 82 |
| California | 69 |
| Ohio | 63 |
Students from 71 countries are represented at this school, with the majority of the international students coming from China, South Korea, and India.
Learn more about international students at Columbia.
A traditional college student is defined as being between the ages of 18-21. At Columbia, 68.50% of students fall into that category, compared to the national average of 60%.
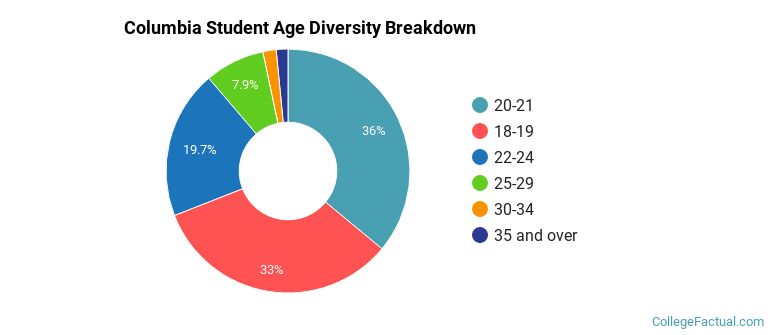
| Student Age Group | Amount |
|---|---|
| 20-21 | 2,612 |
| 18-19 | 2,397 |
| 22-24 | 1,429 |
| 25-29 | 576 |
| 30-34 | 128 |
| 35 and over | 113 |
| Under 18 | 0 |
Footnotes
*The racial-ethnic minorities count is calculated by taking the total number of students and subtracting white students, international students, and students whose race/ethnicity was unknown. This number is then divided by the total number of students at the school to obtain the racial-ethnic minorities percentage.
References
Department of Homeland Security Citizenship and Immigration Services
Image Credit: By Beyond My Ken under License