Here, you'll find out more about the major, including such details as the number of graduates, what degree levels are offered, ethnicity of students, average salaries, and more. We've also included details on how Columbia College Missouri ranks compared to other colleges offering a major in mis.
Jump to any of the following sections:
The mis major at Columbia College Missouri is not ranked on College Factual’s Best Colleges and Universities for Management Information Systems. This could be for a number of reasons, such as not having enough data on the major or school to make an accurate assessment of its quality.
During the 2021-2022 academic year, Columbia College handed out 55 bachelor's degrees in management information systems. This is a decrease of 2% over the previous year when 56 degrees were handed out.
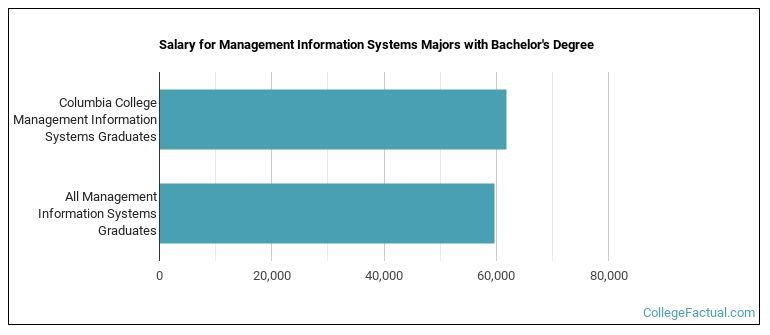
MIS majors who earn their bachelor's degree from Columbia College Missouri go on to jobs where they make a median salary of $61,770 a year. This is great news for graduates of the program, since this figure is higher than the national average of $59,606 for all mis bachelor's degree recipients.
Part-time undergraduates at Columbia College Missouri paid an average of $327 per credit hour in 2022-2023. This tuition was the same for both in-state and out-of-state students. The following table shows the average full-time tuition and fees for undergraduates.
| In State | Out of State | |
|---|---|---|
| Tuition | $12,268 | $12,268 |
| Books and Supplies | $480 | $480 |
| On Campus Room and Board | $8,874 | $8,874 |
| On Campus Other Expenses | $5,248 | $5,248 |
Learn more about Columbia College Missouri tuition and fees.
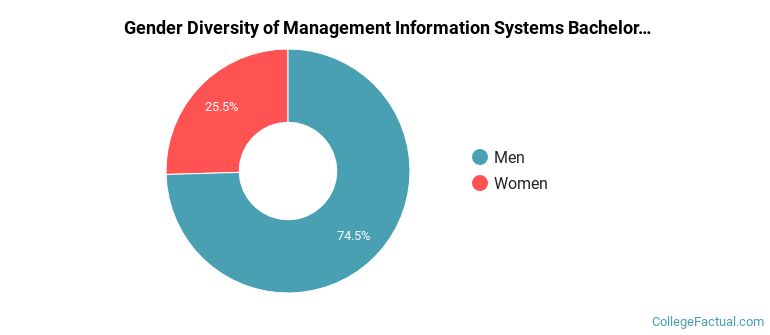
During the 2021-2022 academic year, 55 students graduated with a bachelor's degree in mis from Columbia College Missouri. About 75% were men and 25% were women.
The majority of the students with this major are white. About 55% of 2022 graduates were in this category.
The following table and chart show the ethnic background for students who recently graduated from Columbia College with a bachelor's in mis.
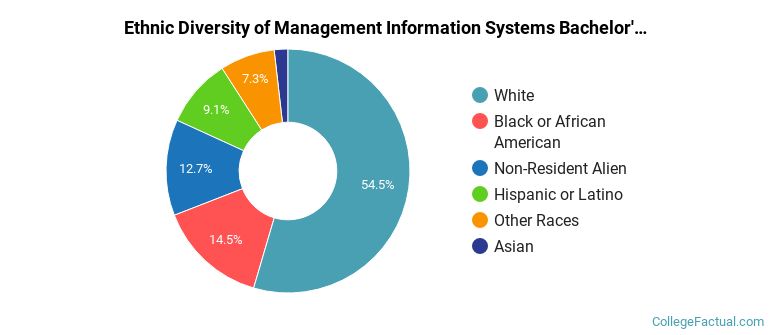
| Ethnic Background | Number of Students |
|---|---|
| Asian | 1 |
| Black or African American | 8 |
| Hispanic or Latino | 5 |
| White | 30 |
| Non-Resident Aliens | 7 |
| Other Races | 4 |
Online degrees for the Columbia College Missouri mis bachelor’s degree program are not available at this time. To see if the school offers distance learning options in other areas, visit the Columbia College Missouri Online Learning page.
Take a look at the following statistics related to the make-up of the mis majors at Columbia College.
| Related Major | Annual Graduates |
|---|---|
| General Business/Commerce | 458 |
| Business Administration & Management | 90 |
| Human Resource Management | 79 |
| Accounting | 60 |
| Marketing | 28 |
More about our data sources and methodologies.