We've gathered data and other essential information about the program, such as the average salary of graduates, ethnicity of students, how many students graduated in recent times, and more. We've also included details on how Columbia ranks compared to other colleges offering a major in other social sciences.
Go directly to any of the following sections:
Learn about start dates, transferring credits, availability of financial aid, and more by contacting the universities below.
Learn to analyze social factors and become an advocate for individual and community health with this online bachelor's from Southern New Hampshire University.
Columbia is in the top 10% of the country for other social sciences. More specifically it was ranked #3 out of 35 schools by College Factual. It is also ranked #1 in New York.
During the 2021-2022 academic year, Columbia University in the City of New York handed out 38 bachelor's degrees in other social sciences. This is a decrease of 76% over the previous year when 159 degrees were handed out.
In 2022, 45 students received their master’s degree in other social sciences from Columbia. This makes it the #2 most popular school for other social sciences master’s degree candidates in the country.
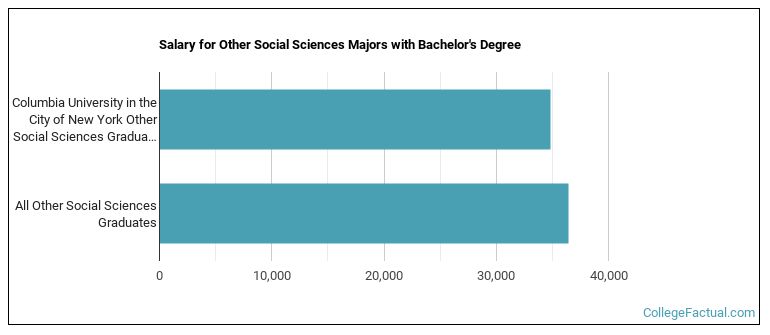
Other Social Sciences majors who earn their bachelor's degree from Columbia go on to jobs where they make a median salary of $34,845 a year. Unfortunately, this is lower than the national average of $36,414 for all other social sciences students.
In 2022-2023, the average part-time undergraduate tuition at Columbia was $2,102 per credit hour for both in-state and out-of-state students. Information about average full-time undergraduate tuition and fees is shown in the table below.
| In State | Out of State | |
|---|---|---|
| Tuition | $64,526 | $64,526 |
| Fees | $3,645 | $3,645 |
| Books and Supplies | $1,392 | $1,392 |
| On Campus Room and Board | $16,800 | $16,800 |
| On Campus Other Expenses | $2,350 | $2,350 |
Learn more about Columbia tuition and fees.
During the 2021-2022 academic year, 38 students graduated with a bachelor's degree in other social sciences from Columbia. About 18% were men and 82% were women.

The following table and chart show the ethnic background for students who recently graduated from Columbia University in the City of New York with a bachelor's in other social sciences.
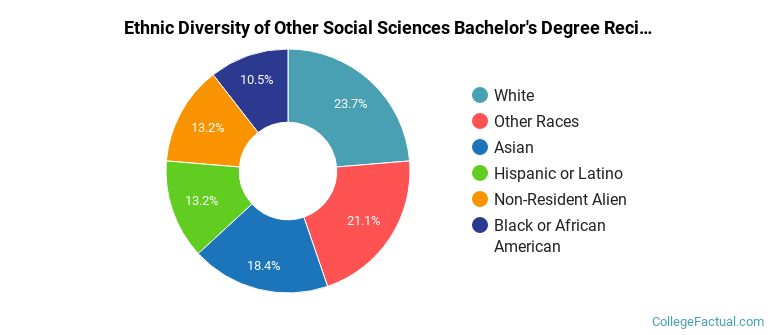
| Ethnic Background | Number of Students |
|---|---|
| Asian | 7 |
| Black or African American | 4 |
| Hispanic or Latino | 5 |
| White | 9 |
| Non-Resident Aliens | 5 |
| Other Races | 8 |
Columbia does not offer an online option for its other social sciences bachelor’s degree program at this time. To see if the school offers distance learning options in other areas, visit the Columbia Online Learning page.
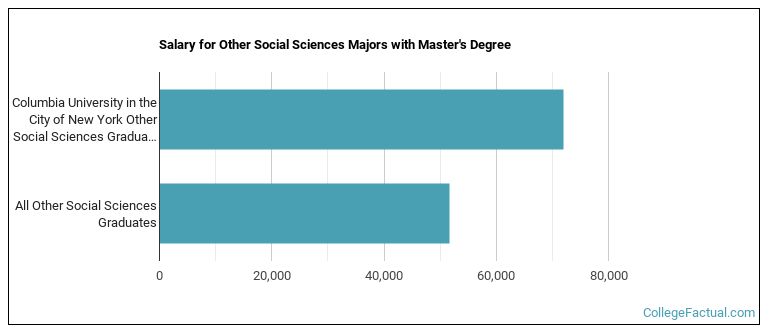
Other Social Sciences majors graduating with a master's degree from Columbia make a median salary of $72,024 a year. This is a better than average outcome since the median salary for all other social sciences graduates with a master's is $51,674.
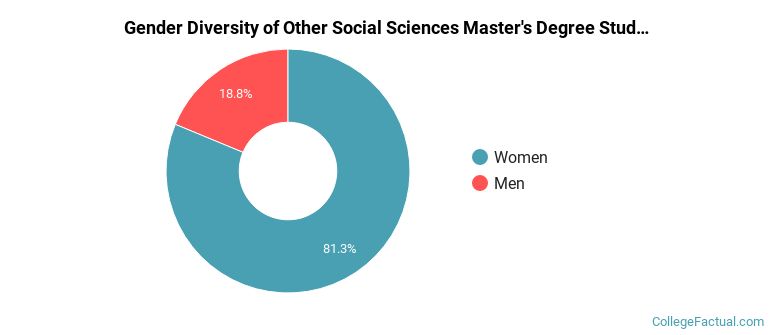
For the most recent academic year available, 19% of other social sciences master's degrees went to men and 81% went to women.
The following table and chart show the ethnic background for students who recently graduated from Columbia University in the City of New York with a master's in other social sciences.
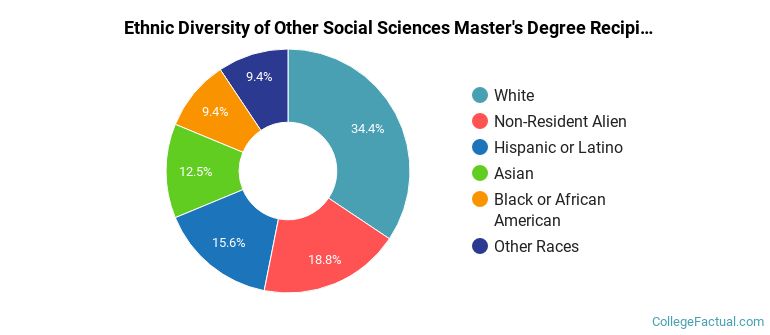
| Ethnic Background | Number of Students |
|---|---|
| Asian | 4 |
| Black or African American | 3 |
| Hispanic or Latino | 5 |
| White | 11 |
| Non-Resident Aliens | 6 |
| Other Races | 3 |
Take a look at the following statistics related to the make-up of the other social sciences majors at Columbia University in the City of New York.
| Related Major | Annual Graduates |
|---|---|
| Economics | 535 |
| Political Science & Government | 308 |
| General Social Sciences | 179 |
| International Relations & National Security | 154 |
| Sociology | 94 |
More about our data sources and methodologies.
