Columbia total enrollment is approximately 30,135 students. 7,509 are undergraduates and 16,294 are graduate students.
Male/Female Breakdown of Undergraduates
The full-time Columbia undergraduate population is made up of 49% women, and 51% men.

For the gender breakdown for all students, go here.
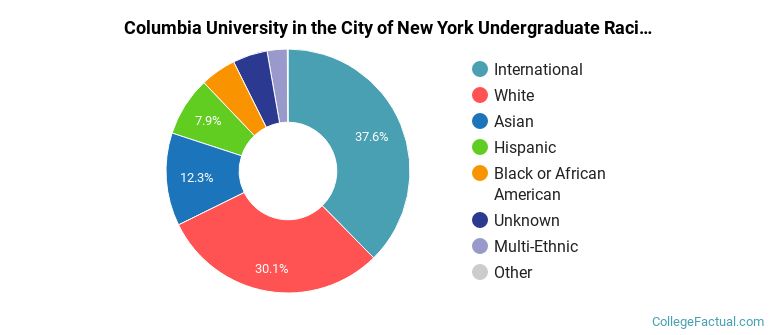
Columbia Racial/Ethnic Breakdown of Undergraduates

| Race/Ethnicity | Number |
|---|---|
| White | 2,370 |
| International | 1,388 |
| Asian | 1,327 |
| Hispanic | 1,106 |
| Black or African American | 533 |
| Multi-Ethnic | 441 |
| Unknown | 302 |
| Native Hawaiian or Pacific Islander | 6 |
See racial/ethnic breakdown for all students.
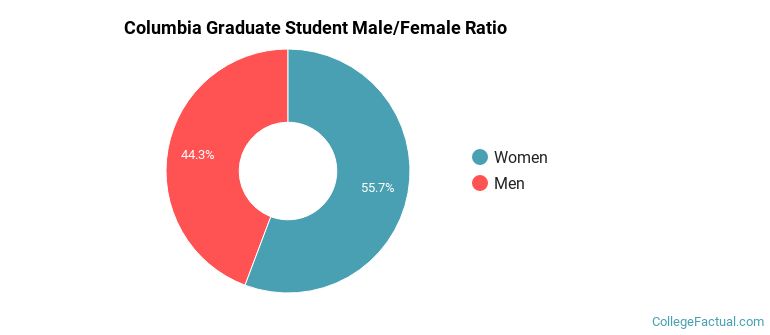
Male/Female Breakdown of Graduate Students
About 56% of full-time grad students are women, and 44% men.
For the gender breakdown for all students, go here.
Columbia Racial-Ethnic Breakdown of Graduate Students

| Race/Ethnicity | Number |
|---|---|
| International | 6,379 |
| White | 5,124 |
| Asian | 1,909 |
| Hispanic | 1,067 |
| Black or African American | 760 |
| Unknown | 656 |
| Multi-Ethnic | 370 |
| Native Hawaiian or Pacific Islander | 8 |
See racial/ethnic breakdown for all students.
| Race/Ethnicity | Number |
|---|---|
| International | 10,522 |
| White | 9,233 |
| Asian | 3,922 |
| Hispanic | 2,560 |
| Black or African American | 1,544 |
| Unknown | 1,343 |
| Multi-Ethnic | 921 |
| Native Hawaiian or Pacific Islander | 24 |

There are approximately 16,094 female students and 14,041 male students at Columbia.
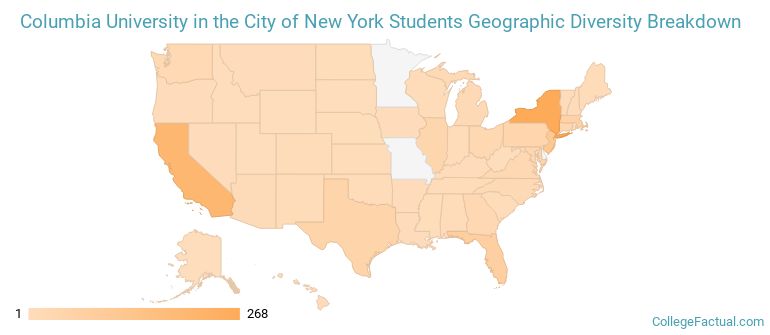
Columbia ranks 15 out of 2,183 when it comes to geographic diversity.
78.8% of Columbia students come from out of state, and 19.68% come from out of the country.
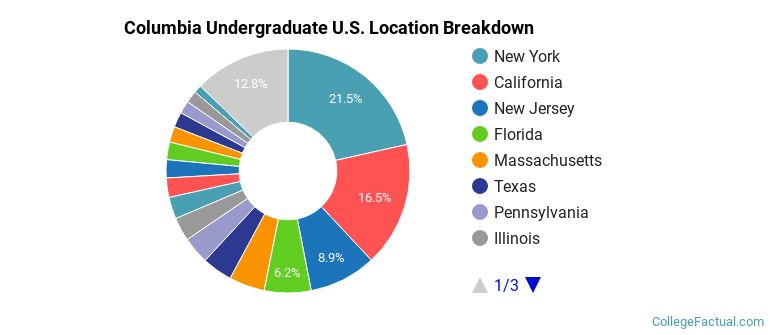
The undergraduate student body is split among 49 states (may include Washington D.C.). Click on the map for more detail.
| State | Amount |
|---|---|
| New York | 268 |
| California | 206 |
| New Jersey | 111 |
| Florida | 77 |
| Massachusetts | 59 |
Students from 144 countries are represented at this school, with the majority of the international students coming from China, India, and South Korea.
Learn more about international students at Columbia.
A traditional college student is defined as being between the ages of 18-21. At Columbia, 19.26% of students fall into that category, compared to the national average of 60%.
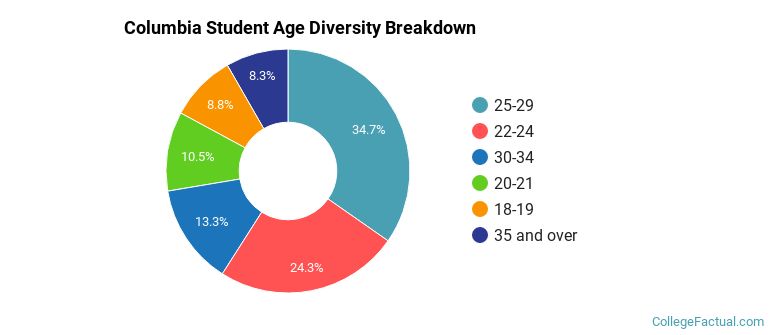
| Student Age Group | Amount |
|---|---|
| 25-29 | 10,516 |
| 22-24 | 7,378 |
| 30-34 | 4,036 |
| 20-21 | 3,189 |
| 18-19 | 2,677 |
| 35 and over | 2,511 |
| Under 18 | 0 |
Footnotes
*The racial-ethnic minorities count is calculated by taking the total number of students and subtracting white students, international students, and students whose race/ethnicity was unknown. This number is then divided by the total number of students at the school to obtain the racial-ethnic minorities percentage.
References