CCAD total enrollment is approximately 1,009 students. 958 are undergraduates and 26 are graduate students.
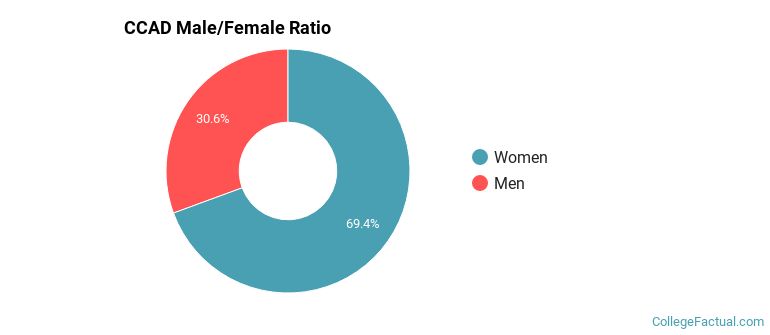
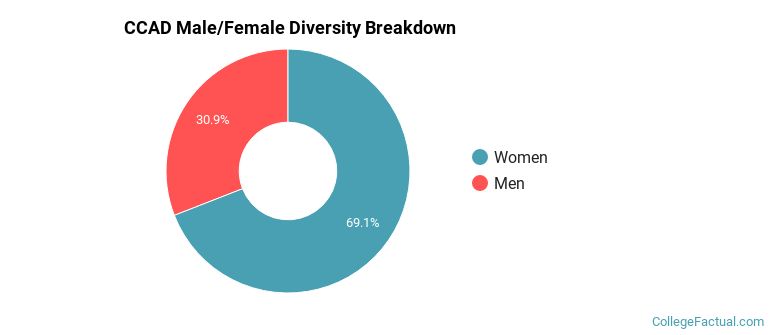
Male/Female Breakdown of Undergraduates
The full-time CCAD undergraduate population is made up of 71% women, and 29% men.
For the gender breakdown for all students, go here.
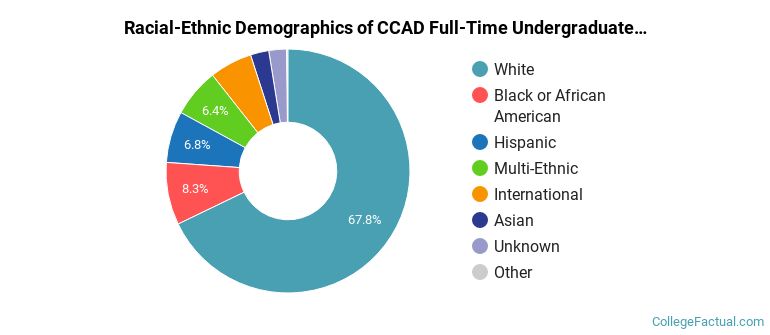
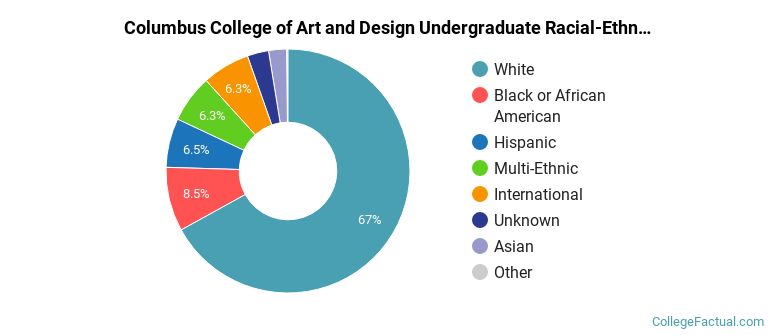
CCAD Racial/Ethnic Breakdown of Undergraduates
| Race/Ethnicity | Number |
|---|---|
| White | 642 |
| Black or African American | 76 |
| Hispanic | 73 |
| Multi-Ethnic | 73 |
| Unknown | 40 |
| Asian | 27 |
| International | 26 |
| Native Hawaiian or Pacific Islander | 1 |
See racial/ethnic breakdown for all students.
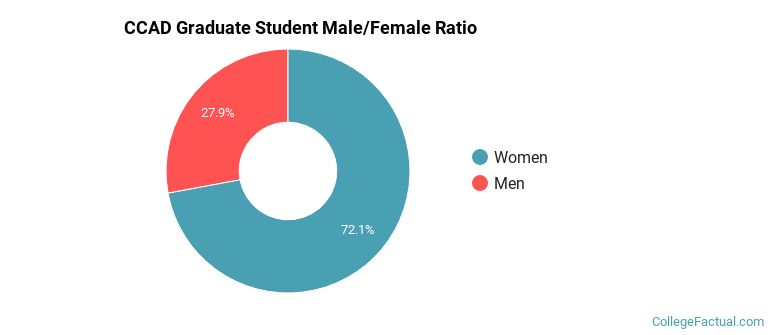
Male/Female Breakdown of Graduate Students
About 81% of full-time grad students are women, and 19% men.
For the gender breakdown for all students, go here.
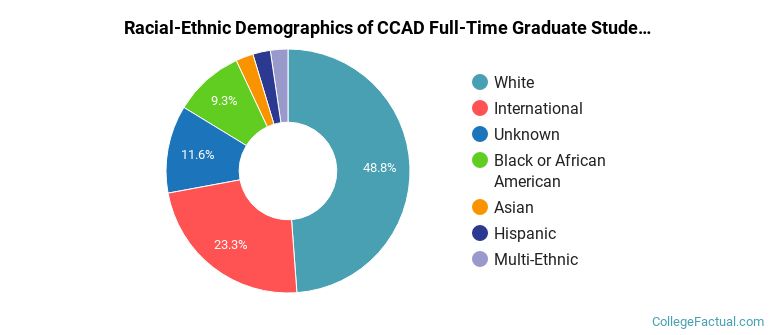
CCAD Racial-Ethnic Breakdown of Graduate Students
| Race/Ethnicity | Number |
|---|---|
| Unknown | 10 |
| White | 9 |
| International | 5 |
| Black or African American | 1 |
| Multi-Ethnic | 1 |
| Asian | 0 |
| Hispanic | 0 |
| Native Hawaiian or Pacific Islander | 0 |
See racial/ethnic breakdown for all students.
| Race/Ethnicity | Number |
|---|---|
| White | 670 |
| Black or African American | 78 |
| Multi-Ethnic | 74 |
| Hispanic | 73 |
| Unknown | 53 |
| International | 31 |
| Asian | 29 |
| Native Hawaiian or Pacific Islander | 1 |
There are approximately 713 female students and 296 male students at CCAD.
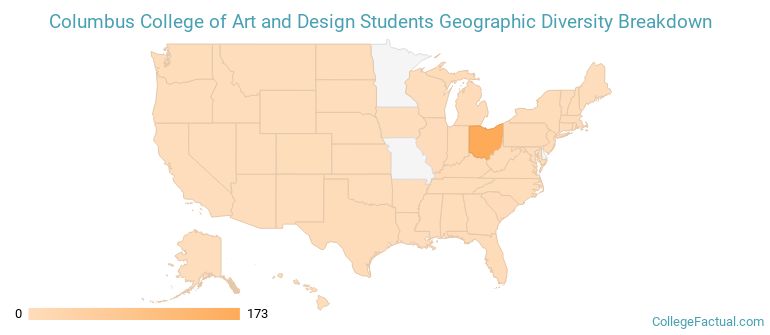
CCAD ranks 902 out of 2,183 when it comes to geographic diversity.
21.72% of CCAD students come from out of state, and 6.67% come from out of the country.
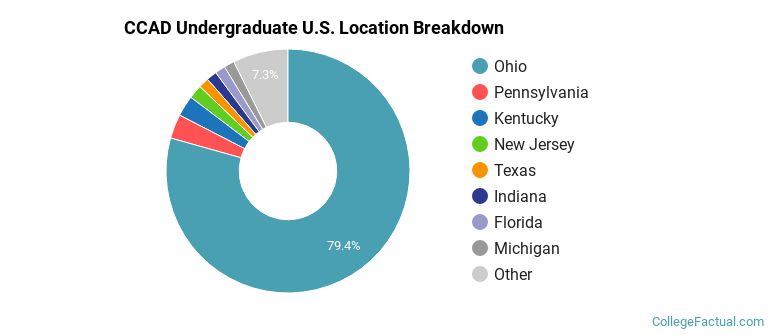
The undergraduate student body is split among 21 states (may include Washington D.C.). Click on the map for more detail.
| State | Amount |
|---|---|
| Ohio | 173 |
| Pennsylvania | 7 |
| Kentucky | 6 |
| New Jersey | 4 |
| Florida | 3 |
Students from 25 countries are represented at this school, with the majority of the international students coming from China, South Korea, and Indonesia.
Learn more about international students at CCAD.
A traditional college student is defined as being between the ages of 18-21. At CCAD, 72.56% of students fall into that category, compared to the national average of 60%.
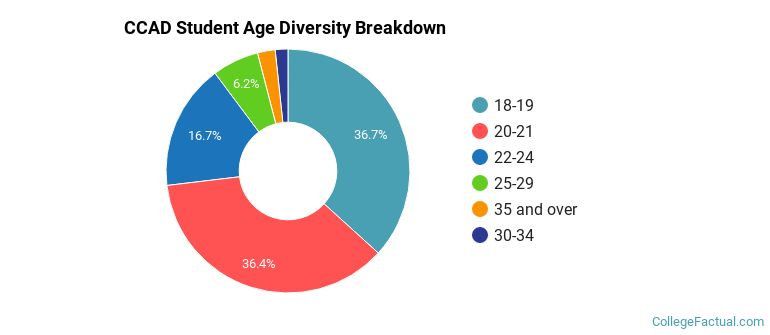
| Student Age Group | Amount |
|---|---|
| 18-19 | 392 |
| 20-21 | 388 |
| 22-24 | 178 |
| 25-29 | 66 |
| 35 and over | 25 |
| 30-34 | 18 |
| Under 18 | 0 |
Footnotes
*The racial-ethnic minorities count is calculated by taking the total number of students and subtracting white students, international students, and students whose race/ethnicity was unknown. This number is then divided by the total number of students at the school to obtain the racial-ethnic minorities percentage.
References
Department of Homeland Security Citizenship and Immigration Services
Image Credit: By Castelein.1 under License