Concordia University, Wisconsin total enrollment is approximately 5,492 students. 2,235 are undergraduates and 1,259 are graduate students.
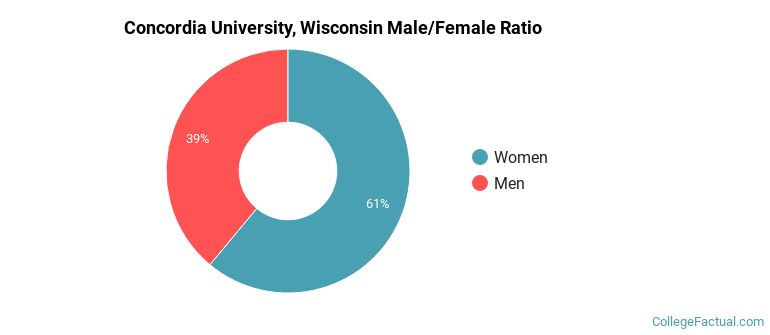
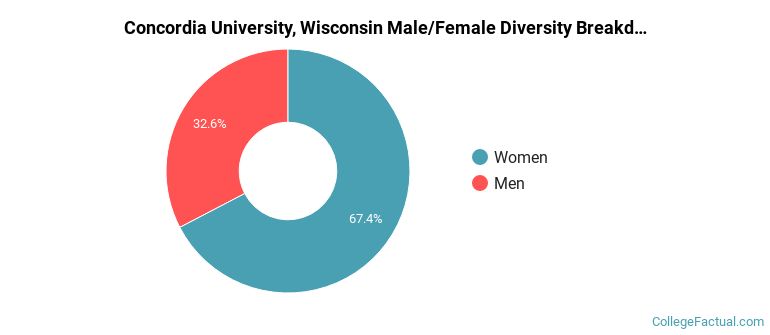
Male/Female Breakdown of Undergraduates
The full-time Concordia University, Wisconsin undergraduate population is made up of 61% women, and 39% men.
For the gender breakdown for all students, go here.
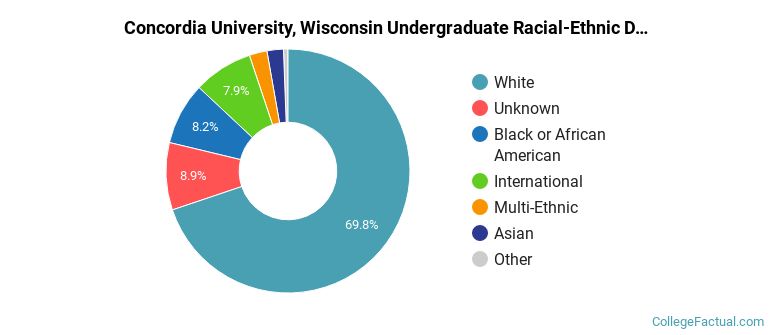
Concordia University, Wisconsin Racial/Ethnic Breakdown of Undergraduates
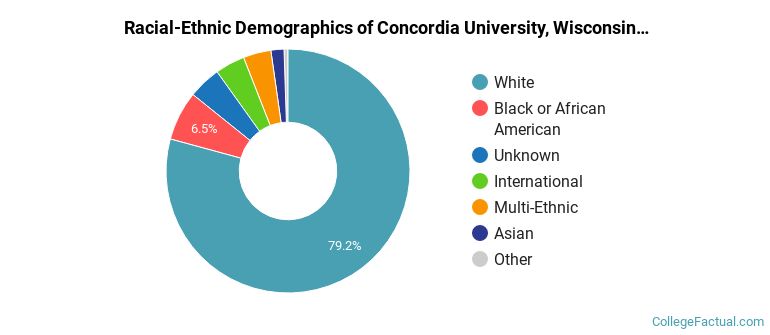
| Race/Ethnicity | Number |
|---|---|
| White | 1,681 |
| Hispanic | 141 |
| Black or African American | 128 |
| International | 86 |
| Multi-Ethnic | 77 |
| Unknown | 65 |
| Asian | 50 |
| Native Hawaiian or Pacific Islander | 1 |
See racial/ethnic breakdown for all students.
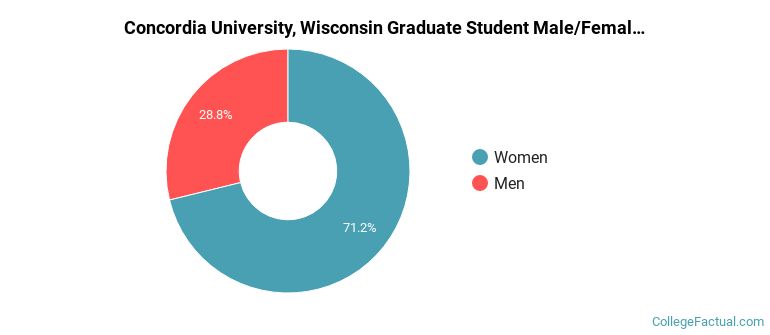
Male/Female Breakdown of Graduate Students
About 70% of full-time grad students are women, and 30% men.
For the gender breakdown for all students, go here.
Concordia University, Wisconsin Racial-Ethnic Breakdown of Graduate Students
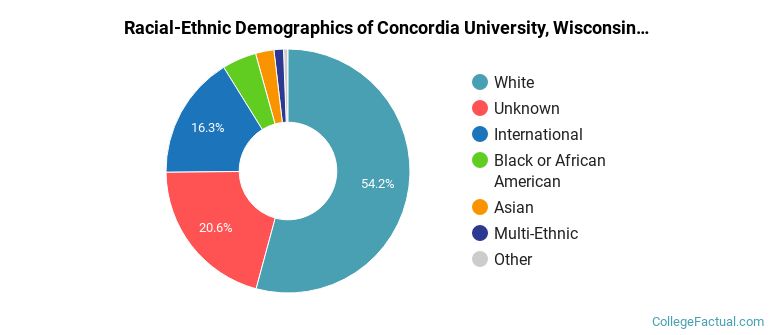
| Race/Ethnicity | Number |
|---|---|
| White | 732 |
| Unknown | 254 |
| International | 143 |
| Black or African American | 49 |
| Hispanic | 32 |
| Asian | 28 |
| Multi-Ethnic | 16 |
| Native Hawaiian or Pacific Islander | 1 |
See racial/ethnic breakdown for all students.
| Race/Ethnicity | Number |
|---|---|
| White | 3,688 |
| Unknown | 457 |
| Black or African American | 423 |
| International | 351 |
| Hispanic | 276 |
| Multi-Ethnic | 137 |
| Asian | 124 |
| Native Hawaiian or Pacific Islander | 2 |
There are approximately 3,699 female students and 1,793 male students at Concordia University, Wisconsin.
Concordia University, Wisconsin ranks 674 out of 2,183 when it comes to geographic diversity.
31.66% of Concordia University, Wisconsin students come from out of state, and 0.21% come from out of the country.
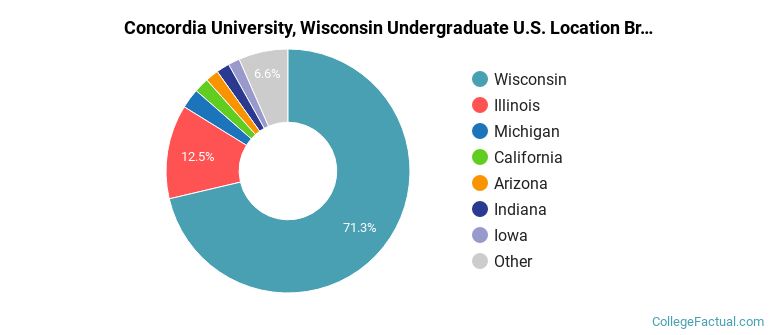
The undergraduate student body is split among 27 states (may include Washington D.C.). Click on the map for more detail.
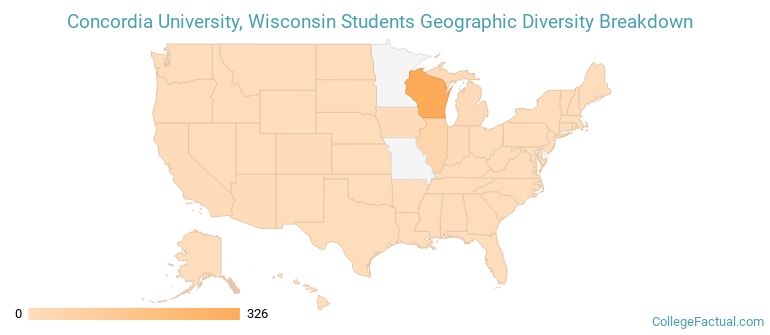
| State | Amount |
|---|---|
| Wisconsin | 326 |
| Illinois | 57 |
| Michigan | 12 |
| California | 9 |
| Arizona | 8 |
Learn more about international students at Concordia University, Wisconsin.
A traditional college student is defined as being between the ages of 18-21. At Concordia University, Wisconsin, 27.81% of students fall into that category, compared to the national average of 60%.
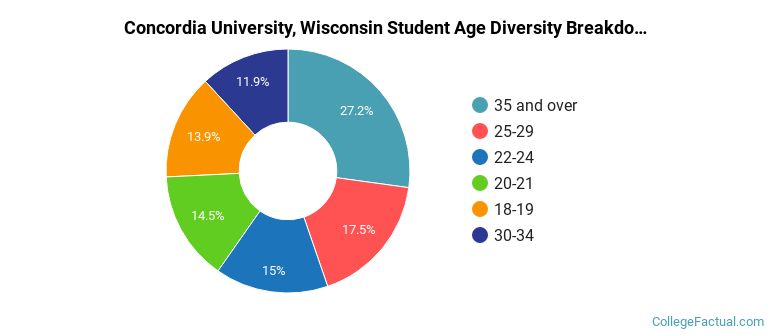
| Student Age Group | Amount |
|---|---|
| 35 and over | 1,938 |
| 25-29 | 1,251 |
| 22-24 | 1,069 |
| 20-21 | 1,034 |
| 18-19 | 993 |
| 30-34 | 845 |
| Under 18 | 0 |
Footnotes
*The racial-ethnic minorities count is calculated by taking the total number of students and subtracting white students, international students, and students whose race/ethnicity was unknown. This number is then divided by the total number of students at the school to obtain the racial-ethnic minorities percentage.
References