
College Factual analyzes over 2,000 colleges and universities in its annual rankings and ranks them in a variety of ways, including most diverse, best overall quality, best for non-traditional students, and much more.
Connors State College was awarded 3 badges in the 2025 rankings. The highest ranked major at the school is health professions.
Explore the best ranked schools for the programs you are most interested in.
CSC landed the #1,104 spot in College Factual's 2025 ranking of best overall colleges in the United States. The higher ed experts analyzed 2,152 colleges and universities across the nation to determine this ranking. This is an improvement over the previous year, when CSC held the #1,590 spot on the Best Overall Colleges list.
CSC also holds the #9 spot on the Best Colleges in Oklahoma ranking.
Since Connors State College has an open admissions policy, being accepted to the school isn't that hard. However, a full basic things - such as a high school diploma or equivalent - may be required. Also, go over your application to make sure it is complete before you submit it.
The student to faculty ratio at Connors State College is 24 to 1, which is high when compared to the national average of 15 to 1. This may indicate that some of your classes will be larger in size than they would be at other schools. However, upper level classes will probably be smaller.
Another measure that is often used to estimate how much access students will have to their professors is how many faculty members are full-time. The idea here is that part-time faculty tend to spend less time on campus, so they may not be as available to students as full-timers.
The full-time faculty percentage at Connors State College is 49%. This is comparable to the national average of 47%.
The freshmen retention rate is a sign of how many full-time students like a college or university well enough to come back for their sophomore year. At Connors State College this rate is 53%, which is a bit lower than the national average of 68%.
During the 2017-2018 academic year, there were 2,069 undergraduates at CSC with 1,108 being full-time and 961 being part-time.
| $0-30 K | $30K-48K | $48-75 | $75-110K | $110K + |
|---|---|---|---|---|
| $11,904 | $9,281 | $11,763 | $14,796 | $15,888 |
The net price is calculated by adding tuition, room, board and other costs and subtracting financial aid.Note that the net price is typically less than the published for a school. For more information on the sticker price of CSC, see our tuition and fees and room and board pages.
It's not uncommon for college students to take out loans to pay for school. In fact, almost 66% of students nationwide depend at least partially on loans. At CSC, approximately 23% of students took out student loans averaging $5,206 a year. That adds up to $20,824 over four years for those students.
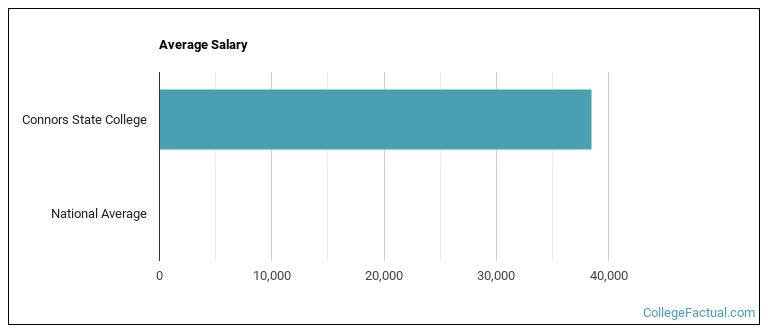
See which majors at Connors State College make the most money.
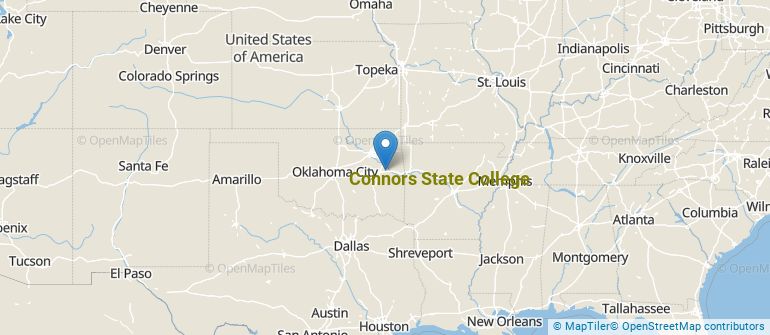
Get more details about the location of Connors State College.
Contact details for CSC are given below.
| Contact Details | |
|---|---|
| Address: | 700 College Road, Warner, OK 74469 |
| Phone: | 918-463-2931 |
| Website: | connorsstate.edu/ |
| Most Popular Majors | Bachelor’s Degrees | Average Salary of Graduates |
|---|---|---|
| Liberal Arts General Studies | 143 | NA |
| Practical Nursing & Nursing Assistants | 129 | NA |
| Nursing | 73 | NA |
| General Agriculture | 41 | NA |
| Health/Medical Prep Programs | 39 | NA |
| Business Administration & Management | 31 | NA |
| Allied Health & Medical Assisting Services | 23 | NA |
| General Biology | 14 | NA |
| Human Development & Family Studies | 14 | NA |
| General Psychology | 13 | NA |
Online learning is becoming popular at even the oldest colleges and universities in the United States. Not only are online classes great for returning adults with busy schedules, they are also frequented by a growing number of traditional students.
In 2022-2023, 1,412 students took at least one online class at Connors State College. This is a decrease from the 1,588 students who took online classes the previous year.
| Year | Took at Least One Online Class | Took All Classes Online |
|---|---|---|
| 2022-2023 | 1,412 | 828 |
| 2021-2022 | 1,588 | 821 |
| 2020-2021 | 1,708 | 758 |
| 2018-2019 | 1,529 | 333 |
Footnotes
*The racial-ethnic minorities count is calculated by taking the total number of students and subtracting white students, international students, and students whose race/ethnicity was unknown. This number is then divided by the total number of students at the school to obtain the racial-ethnic minorities percentage.
References
More about our data sources and methodologies.