Coppin total enrollment is approximately 2,348 students. 1,606 are undergraduates and 74 are graduate students.
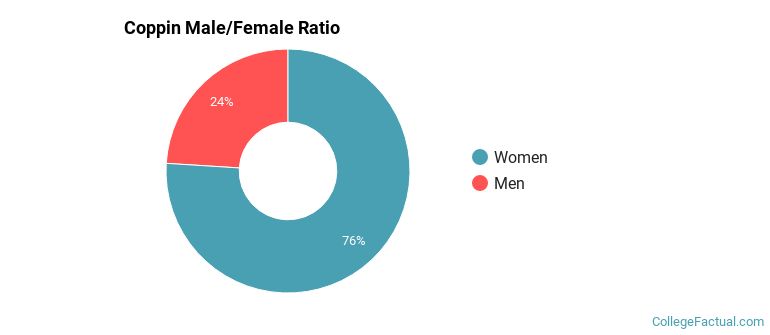
Male/Female Breakdown of Undergraduates
The full-time Coppin undergraduate population is made up of 77% women, and 23% men.
For the gender breakdown for all students, go here.
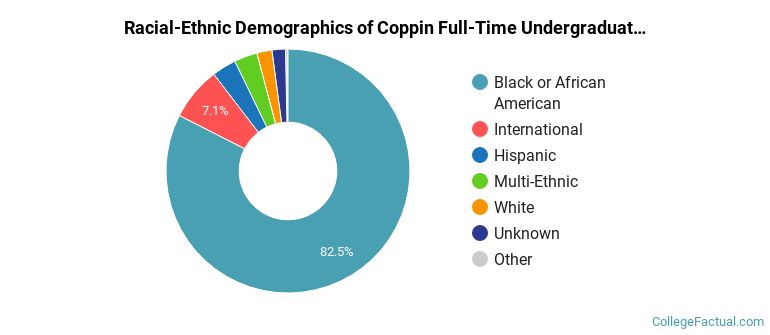
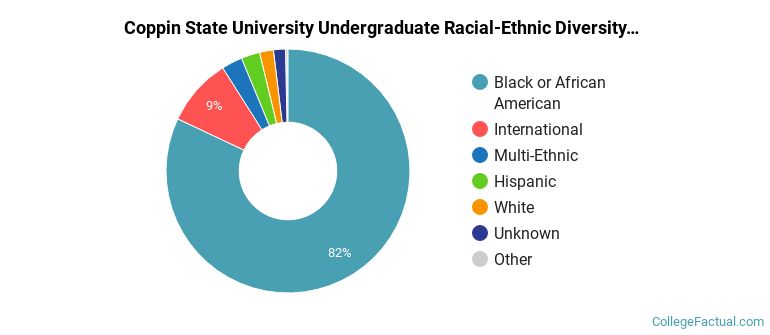
Coppin Racial/Ethnic Breakdown of Undergraduates
| Race/Ethnicity | Number |
|---|---|
| Black or African American | 1,310 |
| International | 118 |
| Hispanic | 64 |
| Multi-Ethnic | 50 |
| White | 31 |
| Unknown | 23 |
| Asian | 5 |
| Native Hawaiian or Pacific Islander | 0 |
See racial/ethnic breakdown for all students.
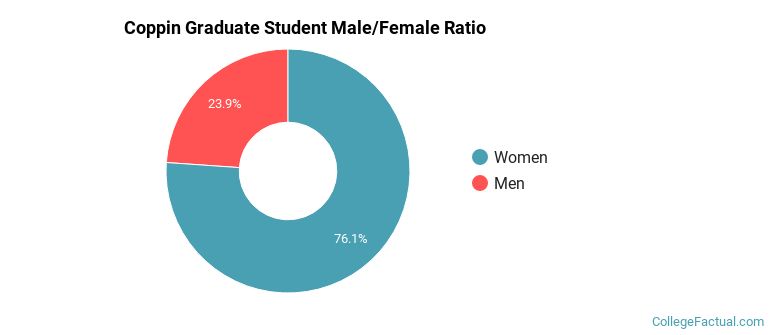
Male/Female Breakdown of Graduate Students
About 77% of full-time grad students are women, and 23% men.
For the gender breakdown for all students, go here.
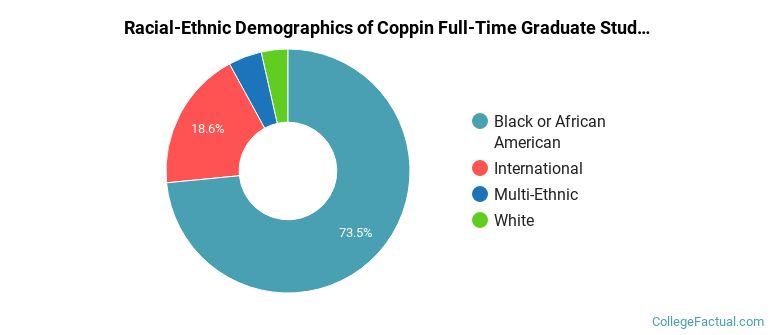
Coppin Racial-Ethnic Breakdown of Graduate Students
| Race/Ethnicity | Number |
|---|---|
| Black or African American | 49 |
| International | 20 |
| Multi-Ethnic | 4 |
| White | 1 |
| Asian | 0 |
| Hispanic | 0 |
| Native Hawaiian or Pacific Islander | 0 |
| Unknown | 0 |
See racial/ethnic breakdown for all students.
| Race/Ethnicity | Number |
|---|---|
| Black or African American | 1,899 |
| International | 215 |
| Hispanic | 75 |
| Multi-Ethnic | 70 |
| White | 40 |
| Unknown | 35 |
| Asian | 7 |
| Native Hawaiian or Pacific Islander | 1 |

There are approximately 1,823 female students and 525 male students at Coppin.
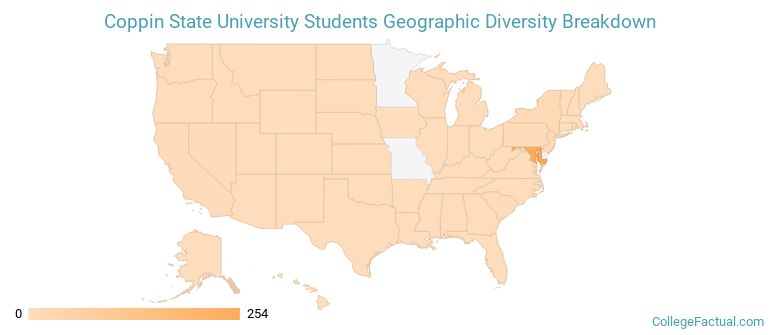
Coppin ranks 1,059 out of 2,183 when it comes to geographic diversity.
20.55% of Coppin students come from out of state, and 17.05% come from out of the country.
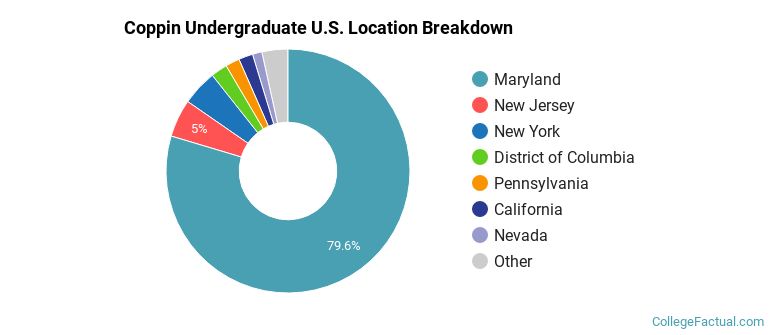
The undergraduate student body is split among 14 states (may include Washington D.C.). Click on the map for more detail.
| State | Amount |
|---|---|
| Maryland | 254 |
| New Jersey | 16 |
| New York | 15 |
| District of Columbia | 7 |
| California | 6 |
Students from 30 countries are represented at this school, with the majority of the international students coming from Nigeria, Kenya, and Canada.
Learn more about international students at Coppin.
A traditional college student is defined as being between the ages of 18-21. At Coppin, 35.40% of students fall into that category, compared to the national average of 60%.
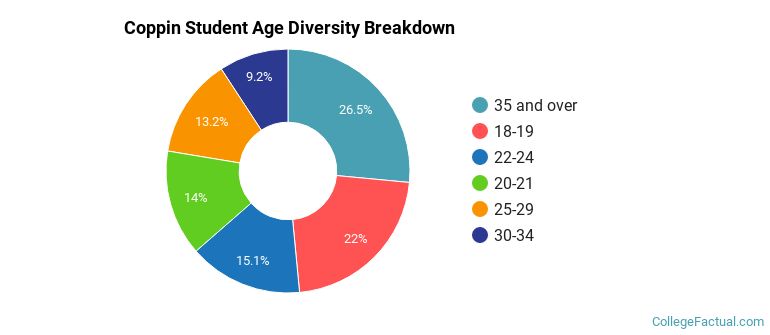
| Student Age Group | Amount |
|---|---|
| 35 and over | 753 |
| 18-19 | 625 |
| 22-24 | 429 |
| 20-21 | 399 |
| 25-29 | 374 |
| 30-34 | 262 |
| Under 18 | 0 |
Footnotes
*The racial-ethnic minorities count is calculated by taking the total number of students and subtracting white students, international students, and students whose race/ethnicity was unknown. This number is then divided by the total number of students at the school to obtain the racial-ethnic minorities percentage.
References
Department of Homeland Security Citizenship and Immigration Services
Image Credit: By Michael Barera under License