Cornell total enrollment is approximately 23,620 students. 14,693 are undergraduates and 8,282 are graduate students.
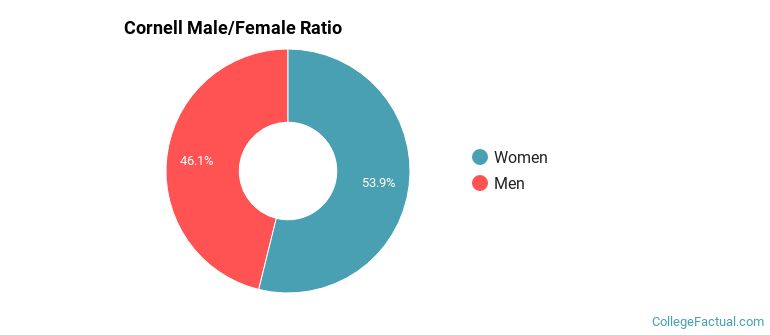
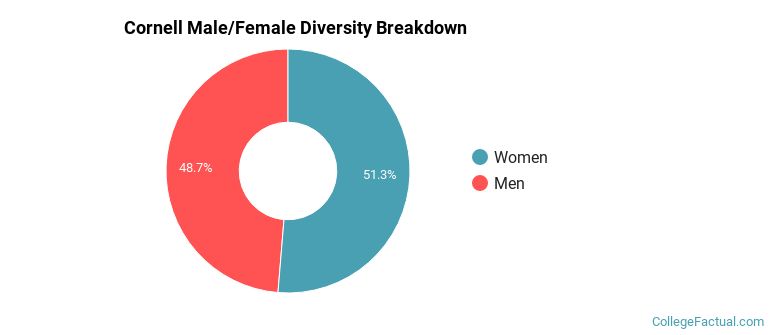
Male/Female Breakdown of Undergraduates
The full-time Cornell undergraduate population is made up of 54% women, and 46% men.
For the gender breakdown for all students, go here.
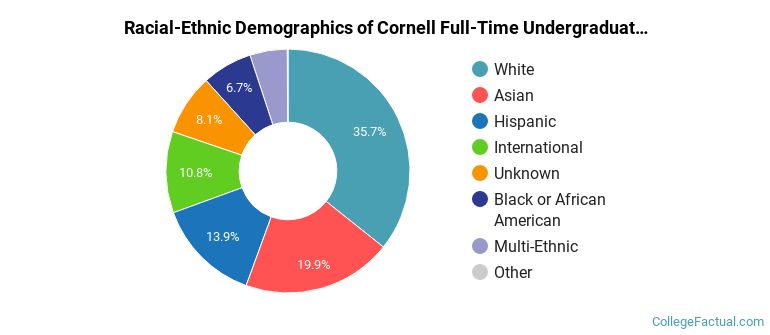
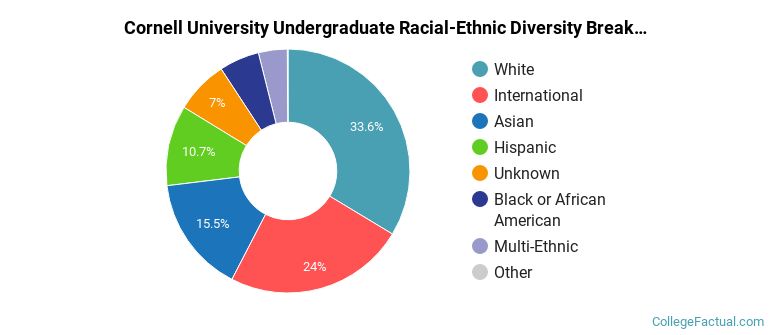
Cornell Racial/Ethnic Breakdown of Undergraduates
| Race/Ethnicity | Number |
|---|---|
| White | 5,096 |
| Asian | 3,065 |
| Hispanic | 2,151 |
| International | 1,431 |
| Unknown | 1,110 |
| Black or African American | 1,052 |
| Multi-Ethnic | 737 |
| Native Hawaiian or Pacific Islander | 16 |
See racial/ethnic breakdown for all students.
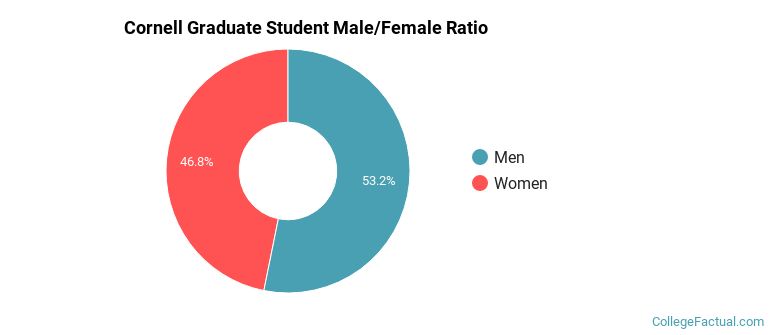
Male/Female Breakdown of Graduate Students
About 47% of full-time grad students are women, and 53% men.
For the gender breakdown for all students, go here.
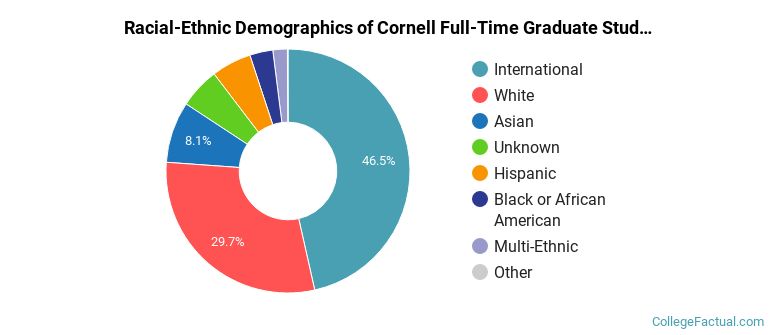
Cornell Racial-Ethnic Breakdown of Graduate Students
| Race/Ethnicity | Number |
|---|---|
| International | 3,518 |
| White | 2,605 |
| Asian | 786 |
| Hispanic | 491 |
| Unknown | 391 |
| Black or African American | 275 |
| Multi-Ethnic | 188 |
| Native Hawaiian or Pacific Islander | 8 |
See racial/ethnic breakdown for all students.
| Race/Ethnicity | Number |
|---|---|
| White | 7,937 |
| International | 5,146 |
| Asian | 3,926 |
| Hispanic | 2,698 |
| Unknown | 1,526 |
| Black or African American | 1,367 |
| Multi-Ethnic | 940 |
| Native Hawaiian or Pacific Islander | 24 |
There are approximately 12,152 female students and 11,468 male students at Cornell.
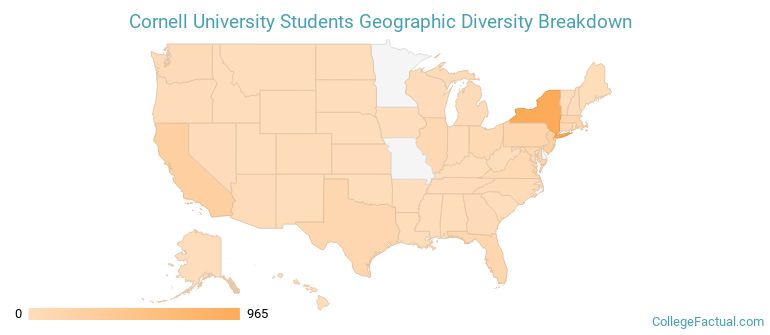
Cornell ranks 91 out of 2,183 when it comes to geographic diversity.
64.84% of Cornell students come from out of state, and 11.04% come from out of the country.
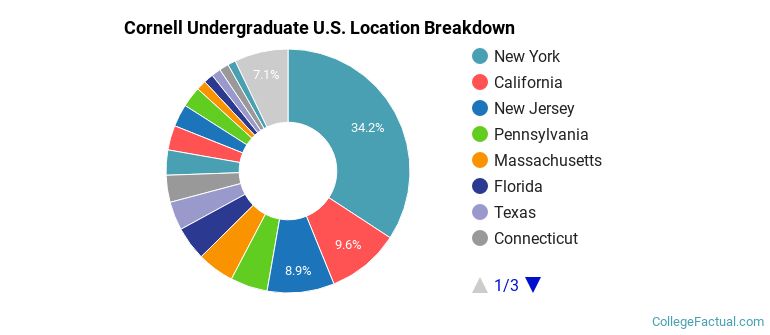
The undergraduate student body is split among 46 states (may include Washington D.C.). Click on the map for more detail.
| State | Amount |
|---|---|
| New York | 965 |
| California | 272 |
| New Jersey | 251 |
| Massachusetts | 139 |
| Pennsylvania | 139 |
Students from 120 countries are represented at this school, with the majority of the international students coming from China, India, and Canada.
Learn more about international students at Cornell.
A traditional college student is defined as being between the ages of 18-21. At Cornell, 59.85% of students fall into that category, compared to the national average of 60%.
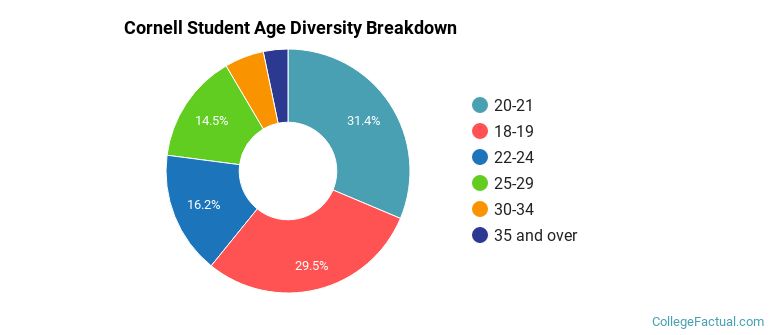
| Student Age Group | Amount |
|---|---|
| 20-21 | 7,099 |
| 18-19 | 6,676 |
| 22-24 | 3,674 |
| 25-29 | 3,275 |
| 30-34 | 1,180 |
| 35 and over | 739 |
| Under 18 | 0 |
Footnotes
*The racial-ethnic minorities count is calculated by taking the total number of students and subtracting white students, international students, and students whose race/ethnicity was unknown. This number is then divided by the total number of students at the school to obtain the racial-ethnic minorities percentage.
References
Department of Homeland Security Citizenship and Immigration Services
Image Credit: By Notyourbroom under License
Read College Factual's Diversity Ranking Methodology.