Creighton total enrollment is approximately 8,770 students. 4,330 are undergraduates and 2,931 are graduate students.
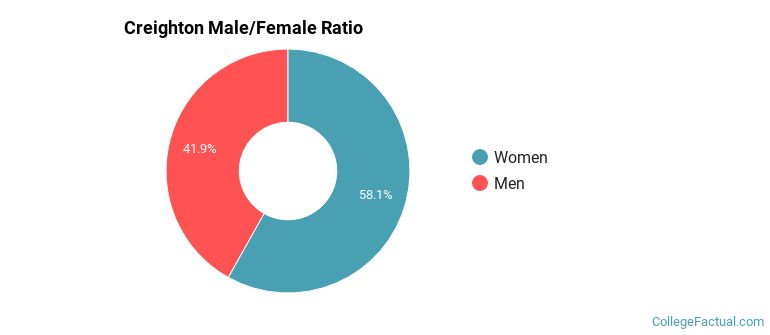
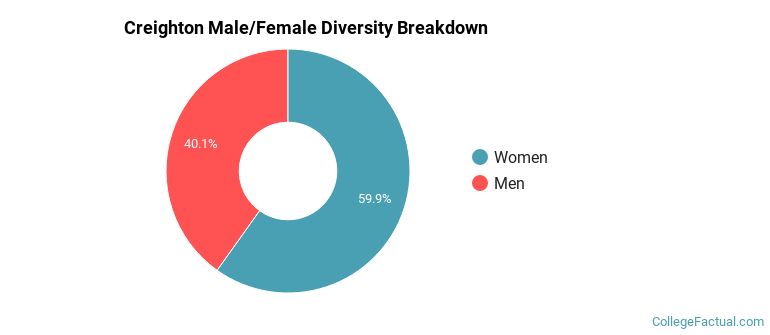
Male/Female Breakdown of Undergraduates
The full-time Creighton undergraduate population is made up of 59% women, and 41% men.
For the gender breakdown for all students, go here.
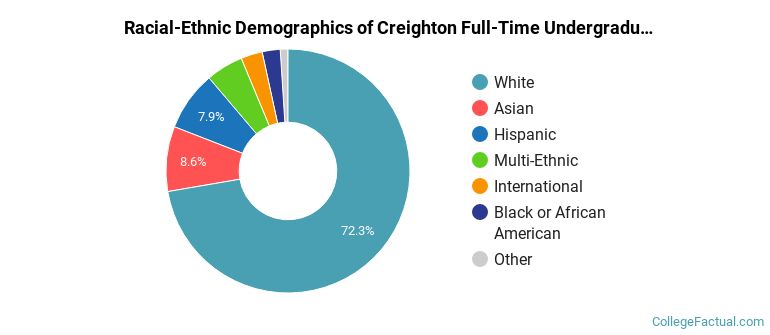
Creighton Racial/Ethnic Breakdown of Undergraduates
| Race/Ethnicity | Number |
|---|---|
| White | 3,140 |
| Hispanic | 386 |
| Asian | 348 |
| Multi-Ethnic | 221 |
| Black or African American | 97 |
| International | 93 |
| Unknown | 21 |
| Native Hawaiian or Pacific Islander | 14 |
See racial/ethnic breakdown for all students.
Male/Female Breakdown of Graduate Students
About 59% of full-time grad students are women, and 41% men.

For the gender breakdown for all students, go here.
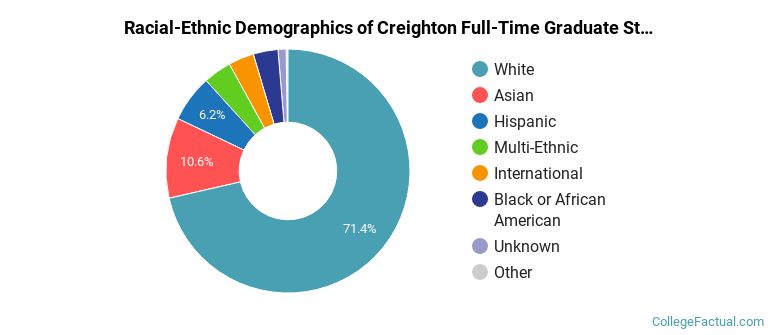
Creighton Racial-Ethnic Breakdown of Graduate Students
| Race/Ethnicity | Number |
|---|---|
| White | 2,095 |
| Asian | 313 |
| Hispanic | 190 |
| Multi-Ethnic | 99 |
| Black or African American | 96 |
| International | 91 |
| Unknown | 37 |
| Native Hawaiian or Pacific Islander | 4 |
See racial/ethnic breakdown for all students.
| Race/Ethnicity | Number |
|---|---|
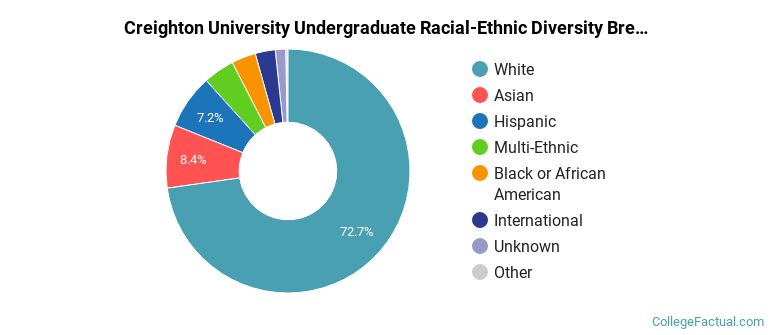
| White | 6,375 |
| Asian | 710 |
| Hispanic | 679 |
| Multi-Ethnic | 365 |
| Black or African American | 279 |
| International | 207 |
| Unknown | 107 |
| Native Hawaiian or Pacific Islander | 22 |
There are approximately 5,239 female students and 3,531 male students at Creighton.
Creighton ranks 116 out of 2,183 when it comes to geographic diversity.
81.89% of Creighton students come from out of state, and 3.39% come from out of the country.

The undergraduate student body is split among 37 states (may include Washington D.C.). Click on the map for more detail.
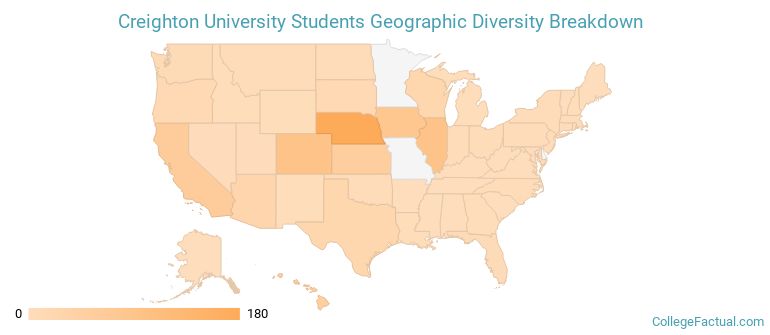
| State | Amount |
|---|---|
| Nebraska | 180 |
| Colorado | 95 |
| Illinois | 92 |
| Iowa | 80 |
| California | 60 |
Students from 59 countries are represented at this school, with the majority of the international students coming from China, Saudi Arabia, and India.
Learn more about international students at Creighton.
A traditional college student is defined as being between the ages of 18-21. At Creighton, 43.38% of students fall into that category, compared to the national average of 60%.
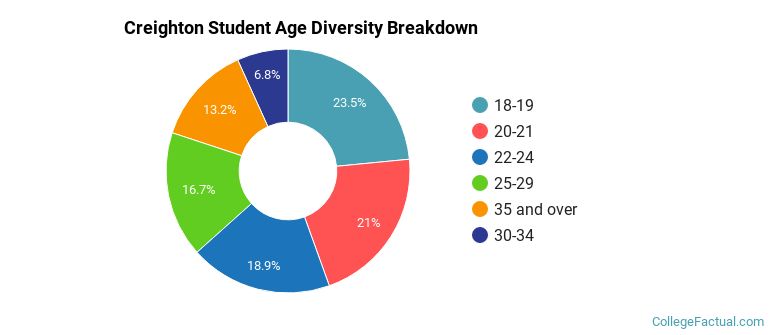
| Student Age Group | Amount |
|---|---|
| 18-19 | 1,979 |
| 20-21 | 1,775 |
| 22-24 | 1,594 |
| 25-29 | 1,407 |
| 35 and over | 1,110 |
| 30-34 | 571 |
| Under 18 | 0 |
Footnotes
*The racial-ethnic minorities count is calculated by taking the total number of students and subtracting white students, international students, and students whose race/ethnicity was unknown. This number is then divided by the total number of students at the school to obtain the racial-ethnic minorities percentage.
References
Department of Homeland Security Citizenship and Immigration Services
Image Credit: By Bluejayscholar under License
Read College Factual's Diversity Ranking Methodology.