Here, you'll find out more about the major, including such details as the number of graduates, what degree levels are offered, ethnicity of students, average salaries, and more. We've also included details on how Brooklyn College ranks compared to other colleges offering a major in subject specific ed.
Go directly to any of the following sections:
In College Factual's most recent rankings for the best schools for subject specific ed majors, Brooklyn College came in at #15. This puts it in the top 5% of the country in this field of study. It is also ranked #6 in New York.
During the 2021-2022 academic year, Brooklyn College handed out 86 bachelor's degrees in teacher education subject specific. This is an increase of 4% over the previous year when 83 degrees were handed out.
In 2022, 129 students received their master’s degree in subject specific ed from Brooklyn College. This makes it the #20 most popular school for subject specific ed master’s degree candidates in the country.
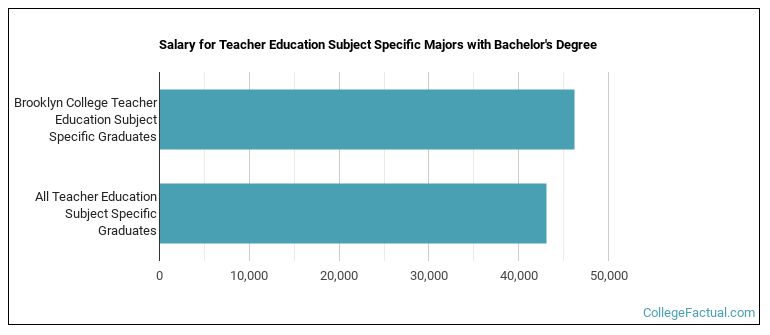
The median salary of subject specific ed students who receive their bachelor's degree at Brooklyn College is $46,233. This is higher than $43,086, which is the national median for all subject specific ed bachelor's degree recipients.
During the 2022-2023 academic year, part-time undergraduate students at Brooklyn College paid an average of $620 per credit hour if they came to the school from out-of-state. In-state students paid a discounted rate of $305 per credit hour. The following table shows the average full-time tuition and fees for undergraduates.
| In State | Out of State | |
|---|---|---|
| Tuition | $6,930 | $14,880 |
| Fees | $522 | $522 |
| Books and Supplies | $1,500 | $1,500 |
Learn more about Brooklyn College tuition and fees.
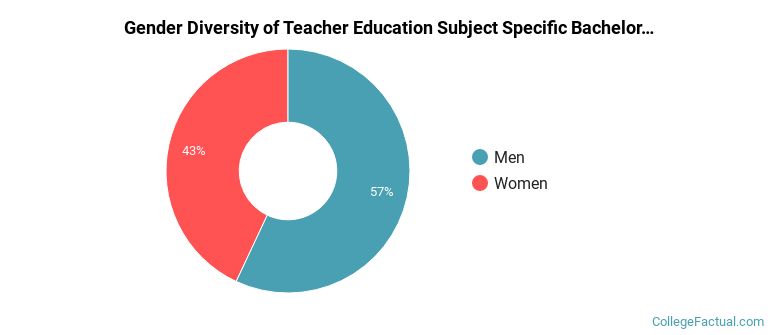
The subject specific ed program at Brooklyn College awarded 86 bachelor's degrees in 2021-2022. About 57% of these degrees went to men with the other 43% going to women.
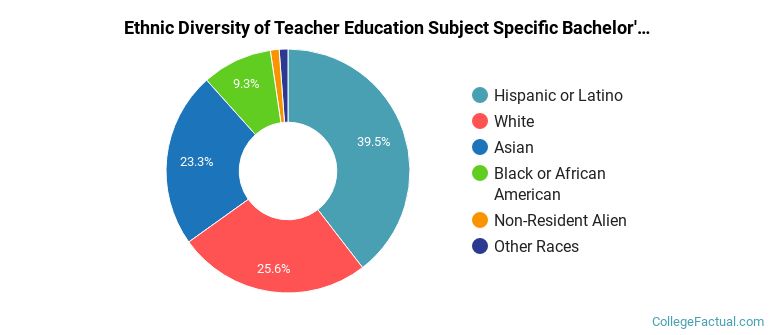
The following table and chart show the ethnic background for students who recently graduated from Brooklyn College with a bachelor's in subject specific ed.
| Ethnic Background | Number of Students |
|---|---|
| Asian | 20 |
| Black or African American | 8 |
| Hispanic or Latino | 34 |
| White | 22 |
| Non-Resident Aliens | 1 |
| Other Races | 1 |
Online degrees for the Brooklyn College subject specific ed bachelor’s degree program are not available at this time. To see if the school offers distance learning options in other areas, visit the Brooklyn College Online Learning page.
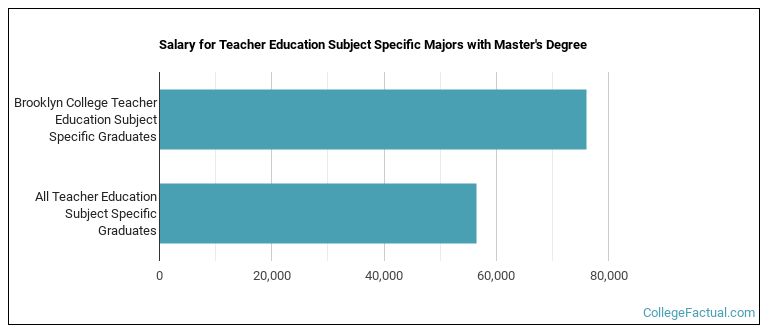
Subject Specific Ed majors graduating with a master's degree from Brooklyn College make a median salary of $76,095 a year. This is a better than average outcome since the median salary for all subject specific ed graduates with a master's is $56,457.
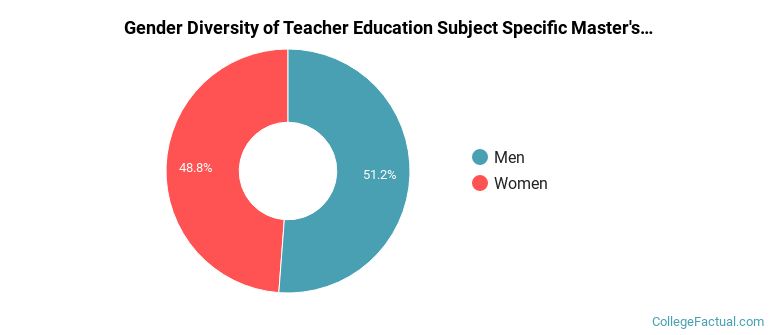
In the 2021-2022 academic year, 125 students earned a master's degree in subject specific ed from Brooklyn College. About 49% of these graduates were women and the other 51% were men.
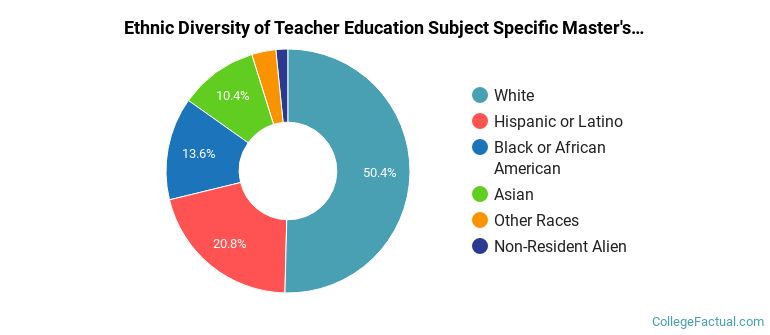
The majority of the students with this major are white. About 50% of 2022 graduates were in this category.
The following table and chart show the ethnic background for students who recently graduated from Brooklyn College with a master's in subject specific ed.
| Ethnic Background | Number of Students |
|---|---|
| Asian | 13 |
| Black or African American | 17 |
| Hispanic or Latino | 26 |
| White | 63 |
| Non-Resident Aliens | 2 |
| Other Races | 4 |
Take a look at the following statistics related to the make-up of the subject specific ed majors at Brooklyn College.
| Related Major | Annual Graduates |
|---|---|
| Teacher Education Grade Specific | 317 |
| Special Education | 145 |
| Student Counseling | 50 |
| Educational Administration | 43 |
| Multilingual Education | 2 |
View All Teacher Education Subject Specific Related Majors >
More about our data sources and methodologies.