We’ve pulled together the essential facts you should know about the program at Hunter. It is offered at the Bachelor’s level. It ranks as high as #3 out of 8 schools (Bachelor’s level) by College Factual. Jump to any of the following sections:
College Factual rates Hunter as a strong choice for ethnic studies, placing at #34 out of 124 schools nationally.
| Ranking | Rank |
|---|---|
| Best Ethnic Studies Schools | 34 of 124 |
| Best Ethnic Studies Schools in New York | 2 of 9 |
| Best Ethnic Studies Schools in the Middle Atlantic Region | 5 of 20 |
Here is each degree level available for ethnic studies at Hunter, along with how many graduates complete each level annually.
| Degree Level | Annual Graduates |
|---|---|
| Bachelor’s | 29 |
During the most recent reporting year, CUNY Hunter College awarded 29 bachelor’s degrees in ethnic studies.
Hunter holds a strong position among schools offering ethnic studies at the bachelor’s level. In particular it placed #3 out of 8 schools by College Factual.
| Ranking | Rank |
|---|---|
| Best Ethnic Studies Bachelor’s Degree Schools in New York | 3 |
| Best Ethnic Studies Bachelor’s Degree Schools in the Middle Atlantic Region | 6 |
| Best Ethnic Studies Bachelor’s Degree Schools | 34 |
Ethnic Studies graduates with a bachelor’s degree from Hunter report a median salary of $51,744 a year. This is below $68,281, the median for all majors at Hunter.
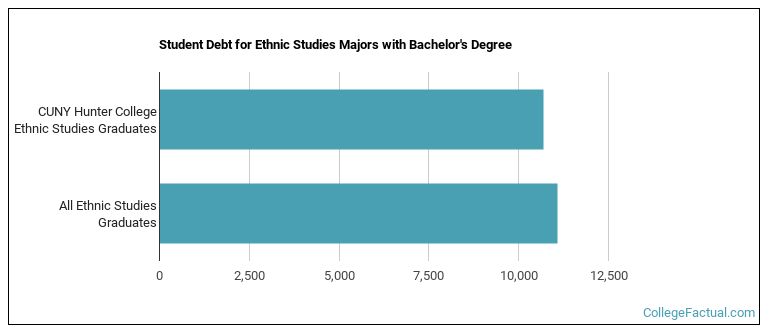
While getting their bachelor’s degree at Hunter, ethnic studies students borrow a median amount of $10,698 in student loans. This is lower than $11,091, the typical median for all majors at Hunter.
Information about average full-time undergraduate tuition and fees is shown in the table below.
| In State | Out of State | |
|---|---|---|
| Tuition | $6,930 | $14,880 |
| Fees | $452 | $452 |
Learn more about Hunter tuition and fees.
For the most recent academic year available, 17% of ethnic studies bachelor’s degrees went to men and 83% went to women.
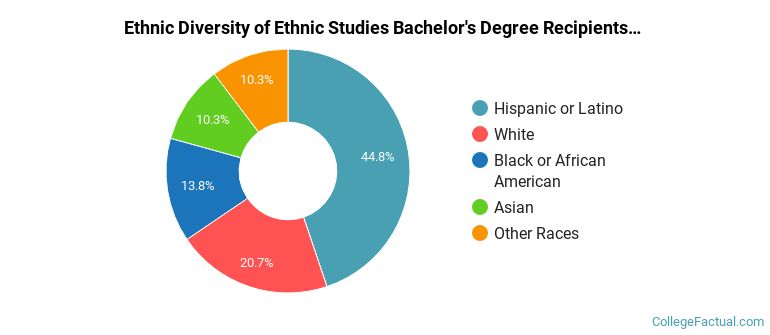
 The largest share of ethnic studies bachelor’s degree graduates at Hunter are Hispanic or Latino. Roughly 45% of graduates fell into this category.
The following table and chart show the ethnic background for students who recently graduated from CUNY Hunter College with a bachelor’s in ethnic studies.
| Ethnic Background | Number of Students |
|---|---|
| Asian | 3 |
| Black or African American | 4 |
| Hispanic or Latino | 13 |
| White | 6 |
| Non-Resident Aliens | 0 |
| Other Races | 3 |
Hunter awarded 23 bachelor’s degrees in women’s studies in the most recent reporting year — 83% to women and 17% to men. Most of these graduates identified as Hispanic or Latino (39%).
Hunter awarded 6 bachelor’s completions in ethnic, cultural minority, gender, and group studies, other recently — 83% to women and 17% to men. Most of these graduates identified as Hispanic or Latino (67%).
