Explore the best ranked schools for the programs you are most interested in.
D&E was not ranked in College Factual's 2025 Best Overall Colleges report. This could be for a number of reasons, including lack of data.
When it comes to admittance, Davis & Elkins College is somewhat selective. Its acceptance rate is 75%, which means you'll face some strong competition during the admissions process. Do what you can to make your application stand out.
About 36% of students accepted to D&E submitted their SAT scores. When looking at the 25th through the 75th percentile, SAT Evidence-Based Reading and Writing scores ranged between 450 and 575. Math scores were between 430 and 550.
The student to faculty ratio is often used to measure the number of teaching resources that a college or university offers its students. The national average for this metric is 15 to 1, but at D&E it is much better at 10 to 1. That's good news for students who want to interact more on a personal level with their teachers.
In addition to the student to faculty ratio, some people look at what percentage of faculty members are full-time as a sign of how much time professors will be able to spend with their students. This is because part-time teachers may not be be on campus as much as their full-time counterparts.
The full-time faculty percentage at Davis & Elkins College is 49%. This is comparable to the national average of 47%.
The freshmen retention rate tells us what percentage of first-year, full-time students choose to continue on to their sophomore year at a particular school. The rate at Davis & Elkins College is 71%, which is about average when compared to the national rate of 68%.
Students are considered to have graduated on time if they finish their studies within four years. At D&E the on-time graduation rate of first-time, full-time students is 43%. That is great when compared to the national average of 33.3%
Find out more about the retention and graduation rates at Davis & Elkins College.
During the 2017-2018 academic year, there were 738 undergraduates at D&E with 691 being full-time and 47 being part-time.
| $0-30 K | $30K-48K | $48-75 | $75-110K | $110K + |
|---|---|---|---|---|
| $18,848 | $14,522 | $19,263 | $20,431 | $23,153 |
The net price is calculated by adding tuition, room, board and other costs and subtracting financial aid.Note that the net price is typically less than the published for a school. For more information on the sticker price of D&E, see our tuition and fees and room and board pages.
Almost 66% of college students who graduated with the class of 2018 took out student loans, but that percentage varies from school to school. At D&E, approximately 66% of students took out student loans averaging $6,561 a year. That adds up to $26,244 over four years for those students.
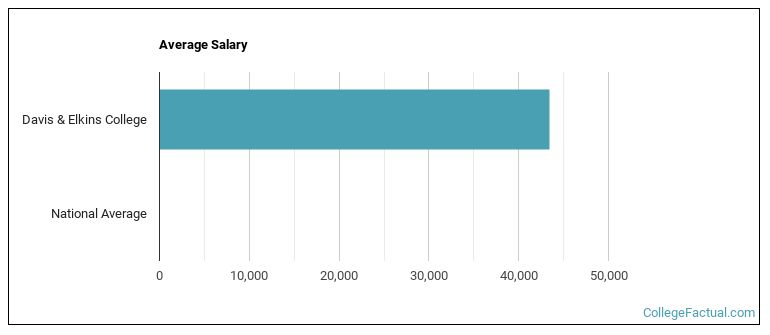
See which majors at Davis & Elkins College make the most money.
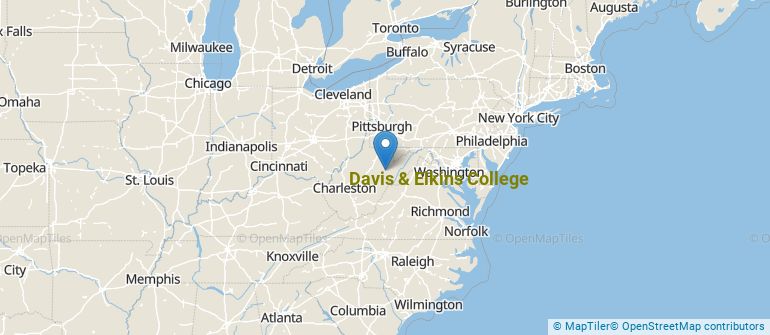
Get more details about the location of Davis & Elkins College.
Contact details for D&E are given below.
| Contact Details | |
|---|---|
| Address: | 100 Campus Dr, Elkins, WV 26241-3996 |
| Phone: | 304-637-1900 |
| Website: | www.dewv.edu/ |
| Most Popular Majors | Bachelor’s Degrees | Average Salary of Graduates |
|---|---|---|
| Nursing | 33 | NA |
| Health & Physical Education | 17 | NA |
| Business Administration & Management | 16 | NA |
| General Psychology | 13 | NA |
| Criminology | 12 | NA |
| Accounting | 7 | NA |
| General Biology | 6 | NA |
| History | 6 | NA |
| Specialized Sales, Merchandising & Marketing | 5 | NA |
| Teacher Education Grade Specific | 5 | NA |
Online learning options are becoming more and more popular at American colleges and universities. Online classes are great for students who have busy schedules or for those who just want to study on their own time.
In 2022-2023, 13 students took at least one online class at Davis & Elkins College. This is a decrease from the 21 students who took online classes the previous year.
| Year | Took at Least One Online Class | Took All Classes Online |
|---|---|---|
| 2022-2023 | 13 | 13 |
| 2021-2022 | 21 | 21 |
| 2020-2021 | 420 | 44 |
| 2018-2019 | 19 | 19 |
If you’re considering Davis & Elkins College, here are some more schools you may be interested in knowing more about.
Curious on how these schools stack up against D&E? Pit them head to head with College Combat, our free interactive tool that lets you compare college on the features that matter most to you!
Footnotes
*The racial-ethnic minorities count is calculated by taking the total number of students and subtracting white students, international students, and students whose race/ethnicity was unknown. This number is then divided by the total number of students at the school to obtain the racial-ethnic minorities percentage.
References
More about our data sources and methodologies.